
Employees at U.S. Scheduled Passenger Airlines Month of March, 1990-2021
Figure
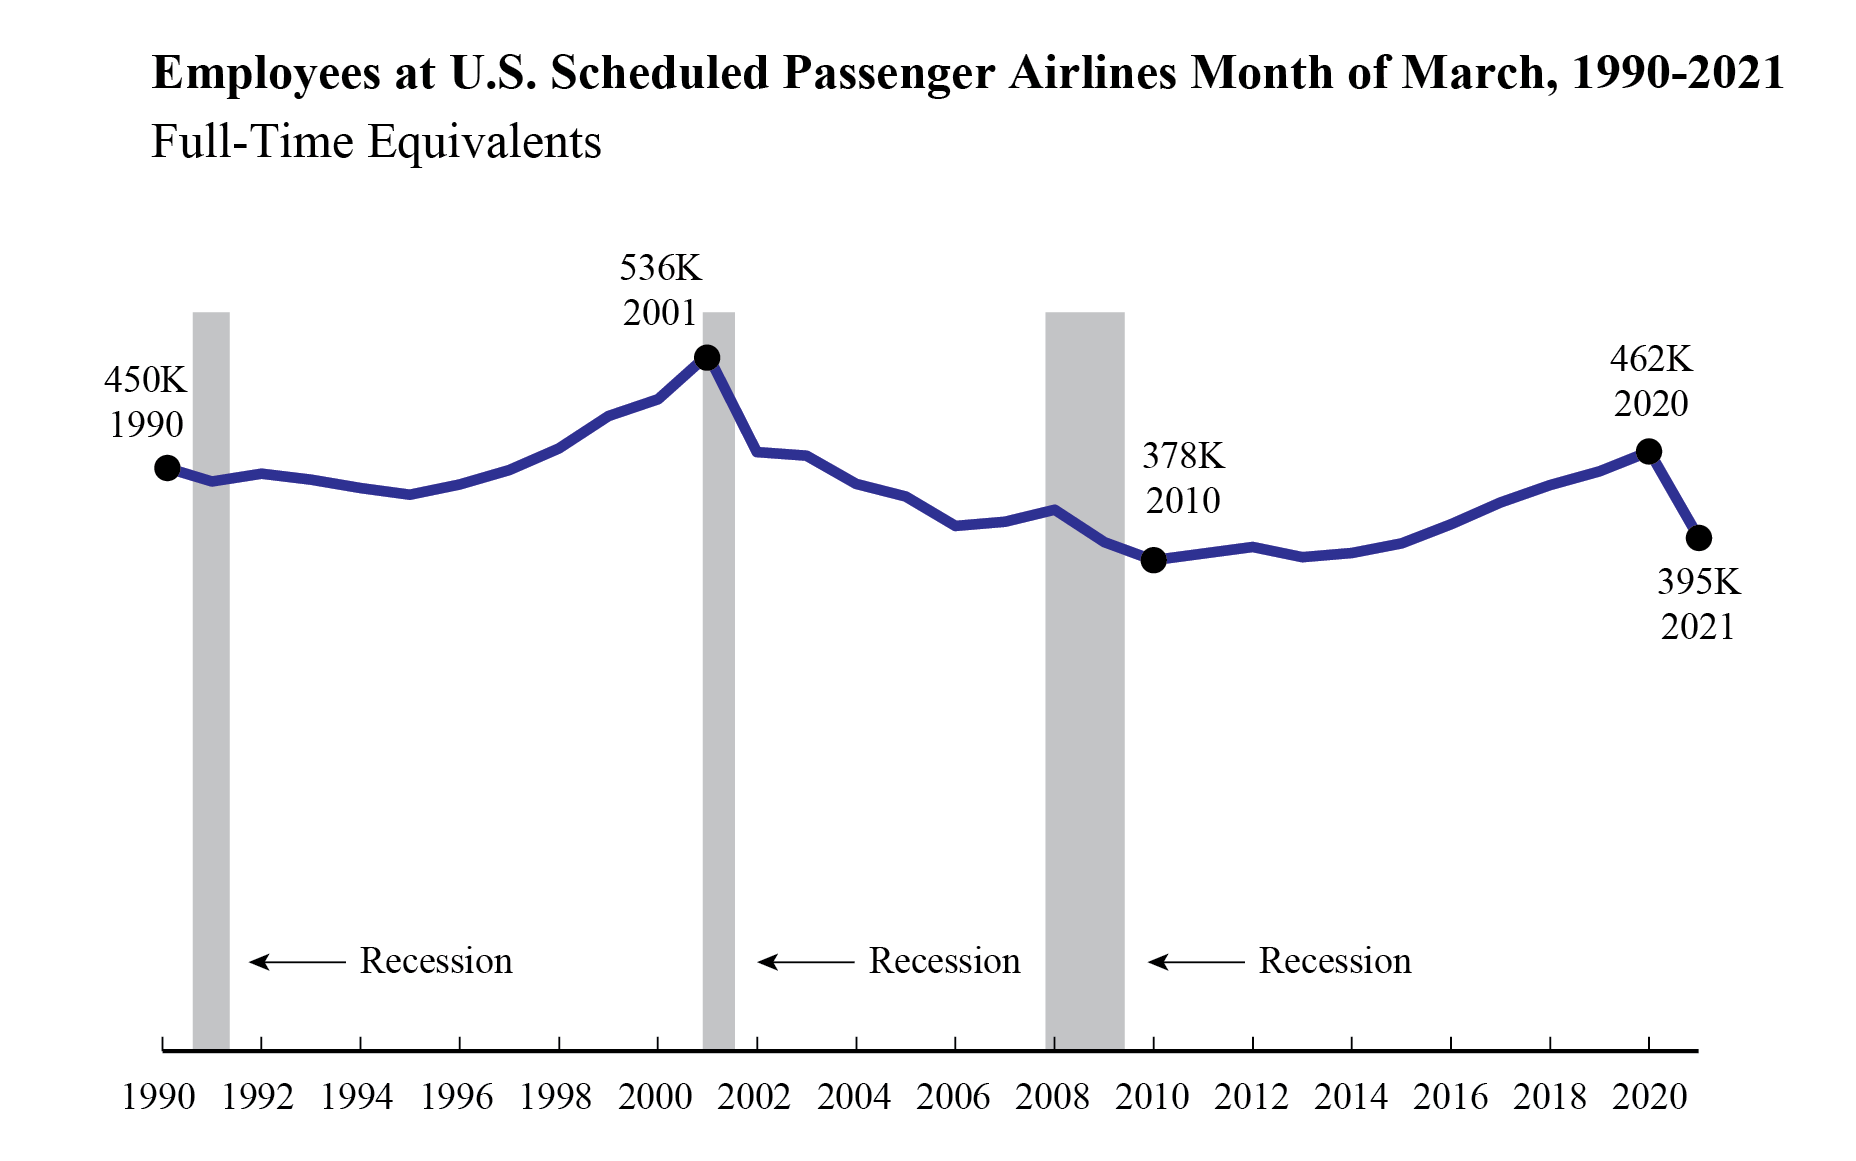
Dataset Table:
| Year | March FTEs in thousands (000) |
|---|---|
| 1990 | 449,953 |
| 1991 | 438,503 |
| 1992 | 444,758 |
| 1993 | 440,145 |
| 1994 | 433,680 |
| 1995 | 428,601 |
| 1996 | 436,153 |
| 1997 | 447,469 |
| 1998 | 463,887 |
| 1999 | 488,942 |
| 2000 | 501,920 |
| 2001 | 536,348 |
| 2002 | 461,395 |
| 2003 | 458,598 |
| 2004 | 436,690 |
| 2005 | 427,093 |
| 2006 | 404,374 |
| 2007 | 407,523 |
| 2008 | 416,914 |
| 2009 | 392,053 |
| 2010 | 377,807 |
| 2011 | 383,311 |
| 2012 | 388,113 |
| 2013 | 380,540 |
| 2014 | 383,575 |
| 2015 | 390,817 |
| 2016 | 405,983 |
| 2017 | 422,278 |
| 2018 | 435,710 |
| 2019 | 446,609 |
| 2020 | 461,597 |
| 2021 | 395,063 |
Notes:
FTE calculations count two part-time employees as one full-time employee.
Description:
Bureau of Transportation Statistics