
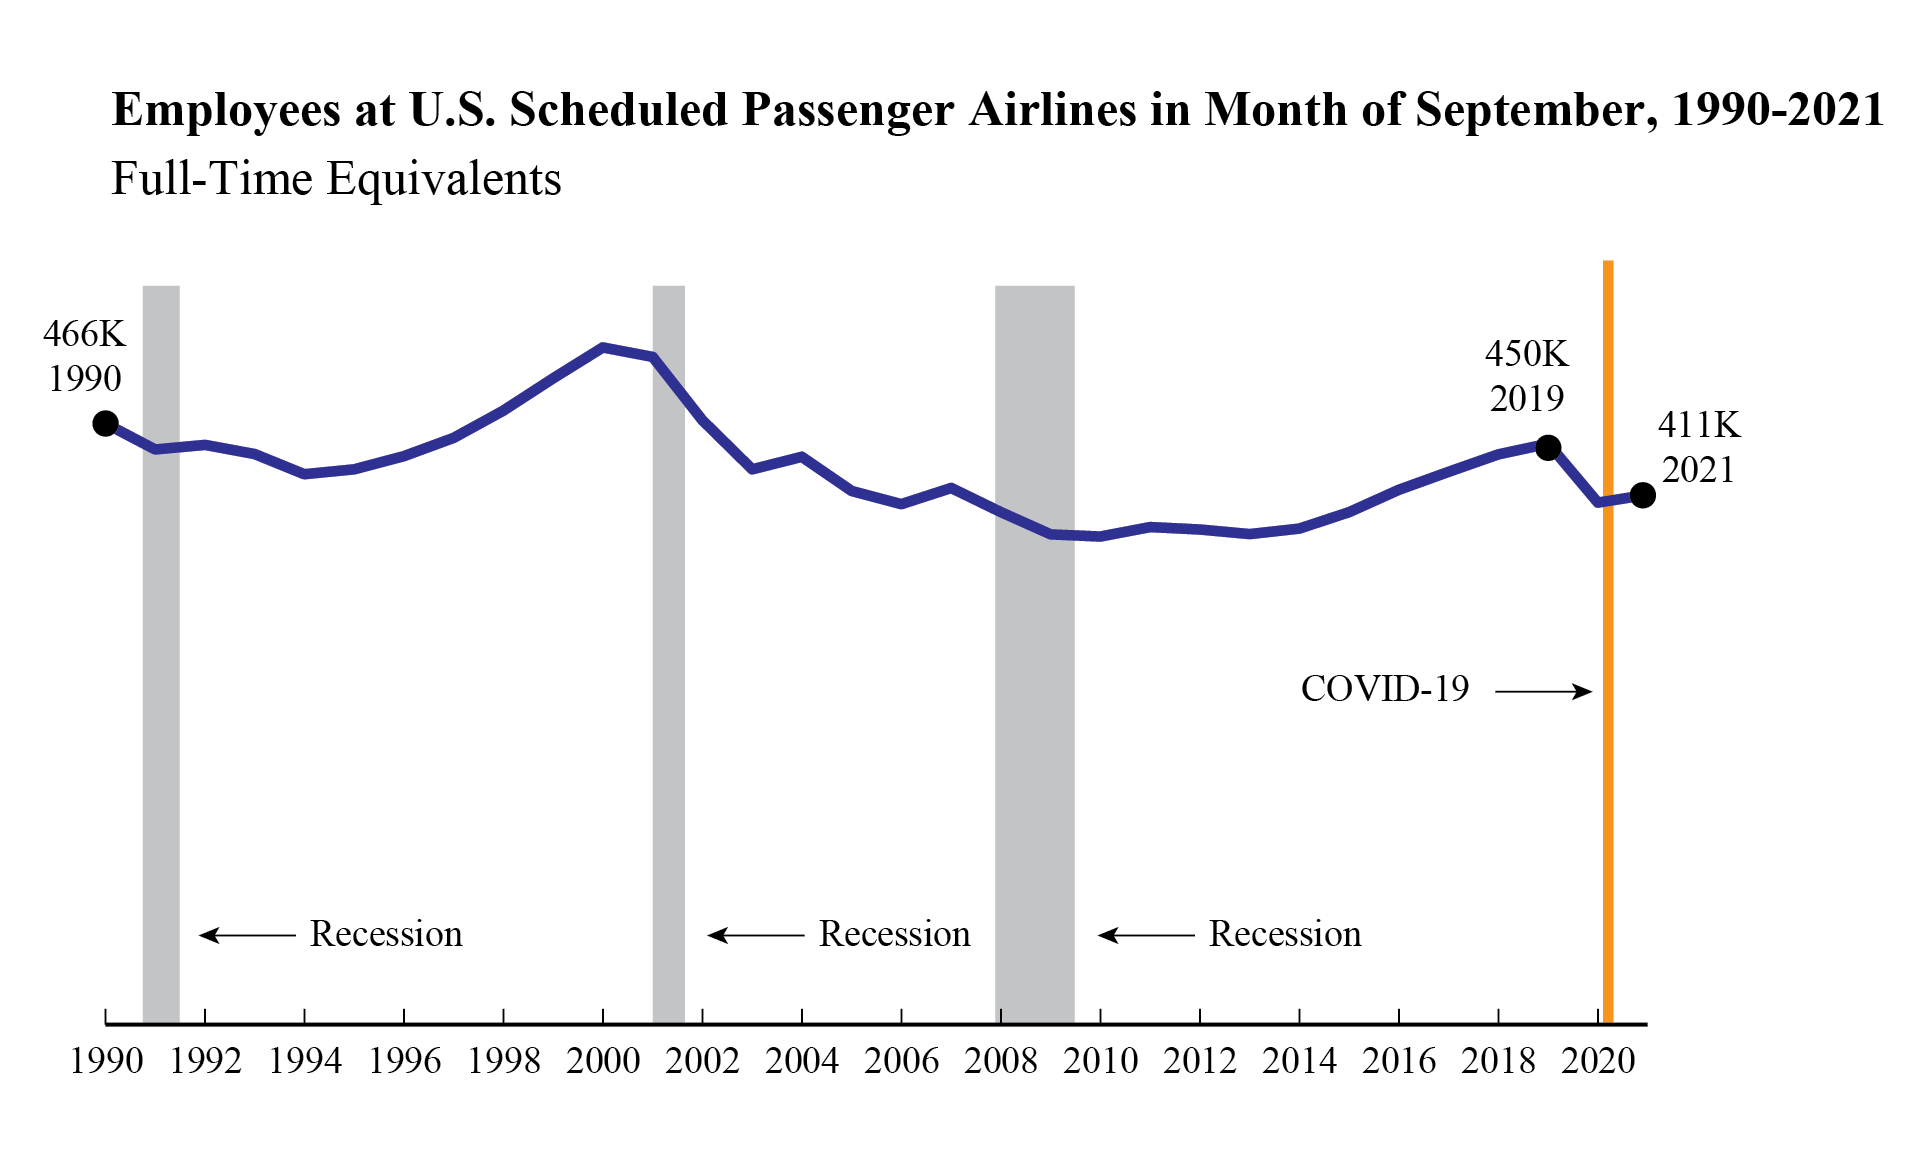
Employees at U.S. Scheduled Passenger Airlines in Month of September 1990-2021
Full-Time Equilvalents
Figure
Dataset Table:
| YEAR | September FTEs |
|---|---|
| 1990 | 466,040 |
| 1991 | 445,822 |
| 1992 | 449,461 |
| 1993 | 442,253 |
| 1994 | 426,787 |
| 1995 | 430,526 |
| 1996 | 440,622 |
| 1997 | 454,767 |
| 1998 | 475,971 |
| 1999 | 501,093 |
| 2000 | 524,916 |
| 2001 | 517,712 |
| 2002 | 468,697 |
| 2003 | 430,416 |
| 2004 | 440,129 |
| 2005 | 413,686 |
| 2006 | 403,476 |
| 2007 | 416,084 |
| 2008 | 397,303 |
| 2009 | 379,932 |
| 2010 | 378,263 |
| 2011 | 385,788 |
| 2012 | 383,735 |
| 2013 | 380,165 |
| 2014 | 384,501 |
| 2015 | 397,326 |
| 2016 | 414,558 |
| 2017 | 428,673 |
| 2018 | 442,049 |
| 2019 | 450,454 |
| 2020 | 404,764 |
| 2021 | 410,836 |