
February 2020 U.S. Airline Cargo Data (Preliminary)
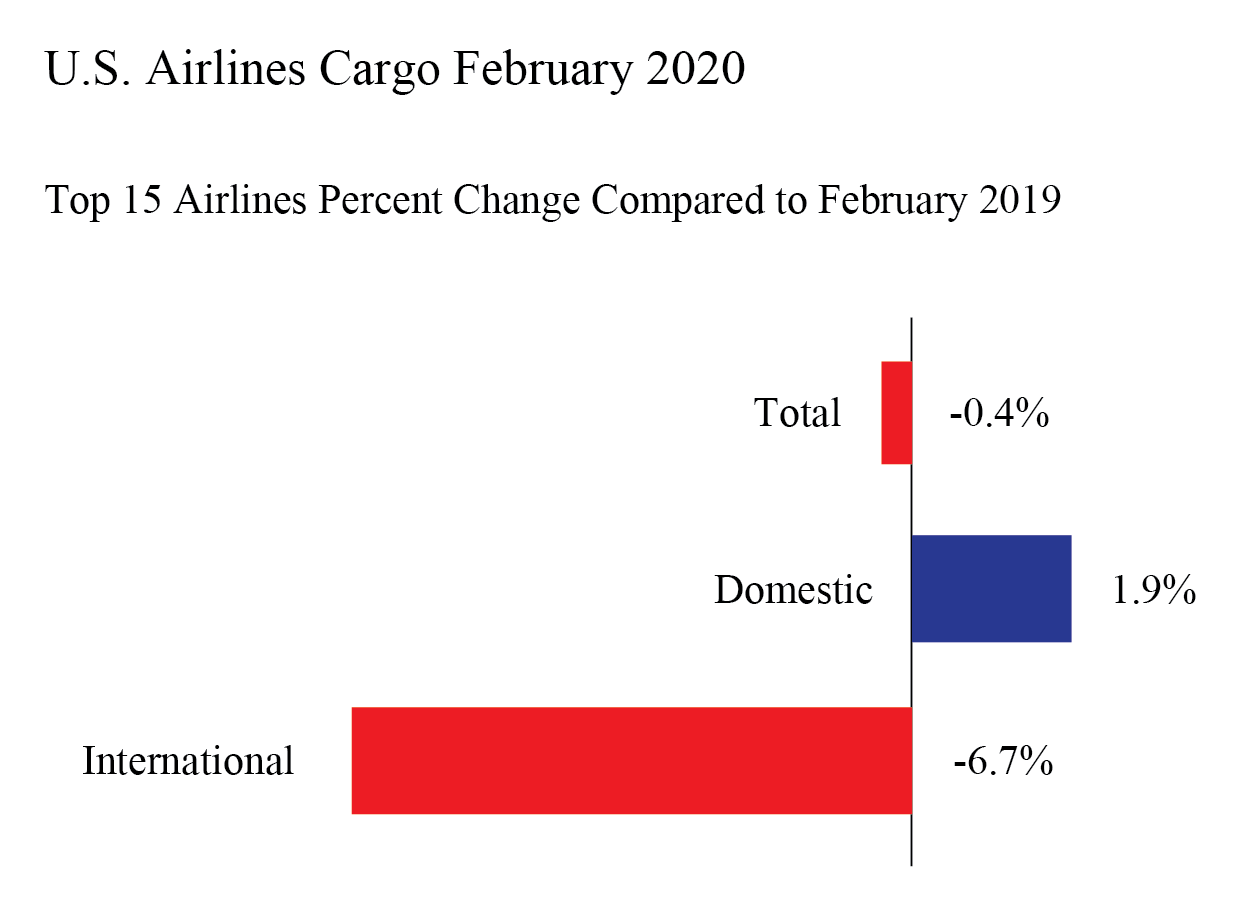
U.S. airlines carried 0.4% less cargo by weight in February 2020 than in February 2019, according to preliminary data filed with the Bureau of Transportation Statistics (BTS) by 15 of the leading cargo airlines.
The 15 airlines carry more than 95% of the total cargo by weight on U.S. airlines. Cargo data consists of freight and mail carried within the U.S. and between the U.S. and foreign points.
February 2020 cargo numbers for the 15 carriers:
- Total: 1,255 thousand tons, down 0.4% from February 2019 (1,260T tons)
- Domestic: 944 thousand tons, up 1.9% from February 2019 (926T tons)
- International: 311 thousand tons, down 6.7% from February 2019 (334T tons)
U.S. air cargo reports are filed monthly with BTS. Final February data will be released on May 14. Complete international data by origin and destination will be released on July 16.
Systemwide Cargo (Domestic + International)
February 2020 would be the fifth month in the last six that the total weight of cargo on U.S. airlines declined from the same month of the previous year. The 0.4% decrease from February 2019 was the smallest of the five year-to-year declines stretching back to September 2019.
| 2016-2017 | 2017-2018 | 2018-2019 | 2019-2020 | |
|---|---|---|---|---|
| January | 6.4 | 10.5 | 5.1 | -0.5 |
| February | 6.1 | 9.2 | -0.3 | -0.4* |
| March | 8.0 | 5.8 | -0.2 | |
| April | 2.6 | 5.9 | 4.4 | |
| May | 10.8 | 9.0 | 3.1 | |
| June | 6.8 | 5.5 | -1.1 | |
| July | 6.9 | 6.7 | 3.5 | |
| August | 9.7 | 5.0 | 0.2 | |
| September | 4.3 | 5.0 | -4.4 | |
| October | 10.6 | 5.5 | -1.2 | |
| November | 10.6 | -0.6 | -2.3 | |
| December | 5.6 | 0.3 | 0.7 | |
| Annual | 7.4 | 5.4 | 0.6 |
Domestic Cargo
February 2020 would be the third consecutive month in which the weight of domestic cargo on U.S. airlines rose from the same month of the previous year. The 1.9% increase from February 2019 would be smaller than the 2.8% increase from January 2019 to January 2020 and the 4.5% increase from December 2018 to December 2019.
| 2016-2017 | 2017-2018 | 2018-2019 | 2019-2020 | |
|---|---|---|---|---|
| January | 4.6 | 10.4 | 6.1 | 2.8 |
| February | 4.9 | 8.7 | 0.7 | 1.9* |
| March | 7.1 | 4.0 | -0.4 | |
| April | 1.5 | 4.9 | 7.7 | |
| May | 10.8 | 8.9 | 4.5 | |
| June | 5.4 | 4.5 | 0.5 | |
| July | 5.2 | 6.7 | 6.2 | |
| August | 9.4 | 4.8 | 0.1 | |
| September | 3.3 | 4.3 | -2.9 | |
| October | 11.1 | 5.7 | 1.8 | |
| November | 11.3 | -0.1 | -1.8 | |
| December | 5.1 | 0.1 | 4.5 | |
| Annual | 6.7 | 5.0 | 2.2 |
International Cargo
February 2020 would be the sixth consecutive month that the weight of international cargo on of U.S. airlines declined from the same month of the previous year. The 6.7% decrease from February 2019 was smaller than both the 9.8% decrease from January 2019 to January 2020 and the 10.6% decrease from December 2018 to December 2019.
| 2016-2017 | 2017-2018 | 2018-2019 | 2019-2020 | |
|---|---|---|---|---|
| January | 11.4 | 10.6 | 2.2 | -9.8 |
| February | 9.6 | 10.4 | -3.1 | -6.7* |
| March | 10.5 | 10.7 | 0.4 | |
| April | 5.3 | 8.2 | -3.9 | |
| May | 11.0 | 9.2 | -0.6 | |
| June | 10.8 | 8.2 | -5.2 | |
| July | 11.3 | 6.7 | -3.6 | |
| August | 10.6 | 5.6 | 0.4 | |
| September | 7.2 | 7.0 | -8.3 | |
| October | 9.4 | 5.0 | -8.7 | |
| November | 8.8 | -1.8 | -3.5 | |
| December | 7.2 | 0.9 | -10.6 | |
| Annual | 9.4 | 6.5 | -3.8 |
Reporting Notes
Data are compiled from monthly reports filed with BTS by commercial U.S. air carriers detailing operations, passenger traffic and freight traffic. This release includes data received by BTS from 15 U.S. airlines as of April 13.
See the BTS Airlines and Airports page for additional U.S. airlines numbers through February for U.S. airlines. International data by origin and destination is available through October.
BTS has scheduled May 14 for the release of reported data through February.
None of the data are from samples. Measures of statistical significance do not apply to the complete air traffic data.