
February 2021 U.S. Passenger Airline Employment Down Over 3,000 Compared to January 2021
Release Number: 26-21
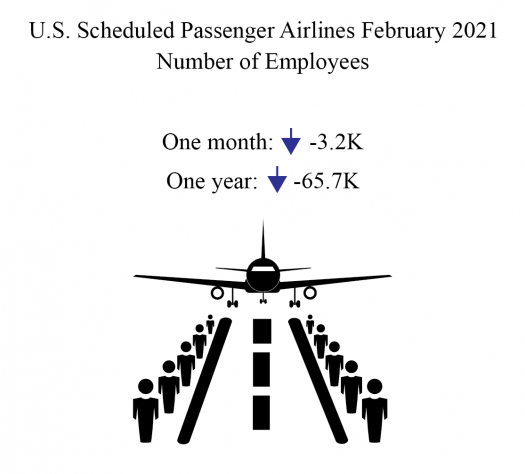
The 22 U.S. scheduled passenger airlines employed 0.8% fewer full-time equivalents (FTEs) in February 2021 than in January 2021:
- February’s total number of FTEs (394,843) was down 3,156 from January (397,999) and down 66,754 from the onset of the pandemic in March 2020 (461,597).
- February 2021 was the lowest FTE total for the month of February since 2015 (388,976).
- February FTEs were down 65,694, a 14.3% drop from February 2020 (460,537).
The decline from January resulted from United Airlines reduction of 6,158 FTEs. Other passenger airlines reported an increase in FTEs from January to February.
In February, scheduled passenger airlines employed 60% of the total airline industry FTEs, down from 63% in March 2020. Total industry includes cargo and charter.
Regulations require U.S. airlines to report employment numbers for employees who worked or received pay for any part of the pay period(s) ending nearest the 15th day of the month. U.S. airline employment reports are filed monthly with the Bureau of Transportation Statistics. See the tables that accompany this release on the BTS website for detailed data since 2015 (Tables 1-15) and industry summary monthly data since 1990.
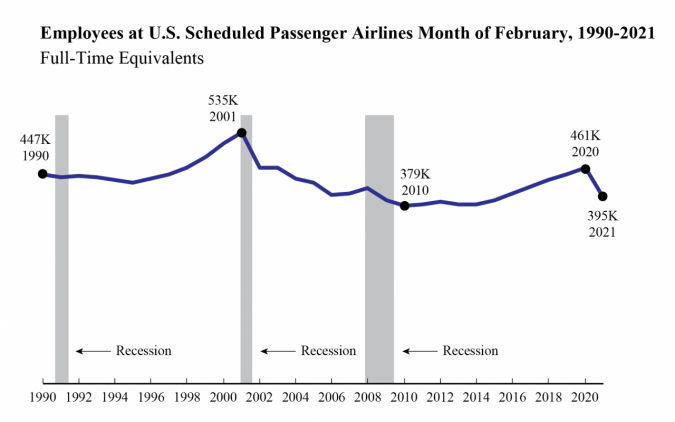
Employees at U.S. Scheduled Passenger Airlines Month of February, 1990-2021
| February FTEs in thousands (000) | |
|---|---|
| 1990 | 446.6 |
| 1991 | 440.6 |
| 1992 | 442.9 |
| 1993 | 439.8 |
| 1994 | 434.3 |
| 1995 | 428.3 |
| 1996 | 435.2 |
| 1997 | 446.1 |
| 1998 | 461.1 |
| 1999 | 483.8 |
| 2000 | 511.0 |
| 2001 | 534.6 |
| 2002 | 461.0 |
| 2003 | 460.9 |
| 2004 | 435.5 |
| 2005 | 427.4 |
| 2006 | 402.8 |
| 2007 | 406.2 |
| 2008 | 415.4 |
| 2009 | 391.6 |
| 2010 | 378.6 |
| 2011 | 382.1 |
| 2012 | 387.2 |
| 2013 | 380.4 |
| 2014 | 382.0 |
| 2015 | 389.0 |
| 2016 | 403.9 |
| 2017 | 419.8 |
| 2018 | 433.7 |
| 2019 | 444.7 |
| 2020 | 460.5 |
| 2021 | 394.8 |
FTE calculations count two part-time employees as one full-time employee.
Bureau of Transportation Statistics
All 22 scheduled service passenger airlines (February)
- 394,843 FTEs
- Down 14.3% (65,694 FTEs) from February 2020 (460,537 FTEs)
- Down 5.9% (24,919 FTEs) from February 2017 (419,762 FTEs)
Four network airlines (February)
American Airlines, Delta Air Lines, United Airlines, Alaska Airlines
- 237,531 FTEs, 60.2% of total scheduled passenger airline FTEs
- Down 18.5% (54,026 FTEs) from February 2020 (291,557 FTEs)
- Down 13.1% (35,834 FTEs) from February 2017 (273,365 FTEs)
- Down 1.7% (4,015 FTEs) from January 2021 (241,546) FTEs
- Down 18.4% (53,678 FTEs) from the onset of the pandemic in March 2020 (291,209) FTEs
Network airlines operate a significant portion of their flights using at least one hub where connections are made for flights to down-line destinations or spoke cities. Note that beginning with January 2018 data, Virgin America’s numbers are included with Alaska Airlines in the network category.
Five low-cost airlines (February)
Southwest Airlines, JetBlue Airways, Spirit Airlines, Frontier Airlines, Allegiant Air
- 90,961 FTEs, 23% of total scheduled passenger airline FTEs
- Down 7.8% (7,689 FTEs) from February 2020 (98,650 FTEs)
- Up 4.5% (3,931 FTEs) from February 2017 (87,030 FTEs)
- Down 0.2% (213 FTEs) from January 2021 (91,174) FTEs
- Down 7.7% (7,570 FTEs) from the onset of the pandemic in March 2020 (98,531) FTEs
Low-cost airlines operate under a low-cost business model, with infrastructure and aircraft operating costs below the overall industry average.
Nine regional airlines (February)
SkyWest Airlines, Envoy Air, Piedmont Airlines, Republic Airlines, Endeavor Air, PSA Airlines, Horizon Air, Mesa Airlines, GoJet Airlines
- 58,327 FTEs, 14.8% of total scheduled passenger airline FTEs
- Down 4.5% (2,734 FTEs) from February 2020 (61,061 FTEs)
- Up 13% (6,713 FTEs) from February 2017 (51,614 FTEs)
- Up 0.9% (493 FTEs) from January 2021 (57,834 FTEs)
- Down 6.8% (4,240 FTEs) from the onset of the pandemic in March 2020 (62,567 FTEs)
Regional carriers typically provide service from small cities, using primarily regional jets to support the network carriers’ hub and spoke systems.
Top Employers by Group
- Network: American 95,849 FTEs
- Low-Cost: Southwest 56,335 FTEs
- Regional: SkyWest 17,256 FTEs
Four other airlines included in industry totals
Other carriers generally operate within specific niche markets. They are: Hawaiian Airlines, Sun Country Airlines, Silver Airlines and Eastern Airlines.
Reporting Notes
Airlines that operate at least one aircraft that has more than 60 seats or the capacity to carry a payload of passengers, cargo and fuel weighing more than 18,000 pounds must report monthly employment statistics.
Data are compiled from monthly reports filed with BTS by commercial air carriers as of April 8. Additional airline employment data and previous releases can be found on the BTS website. BTS has scheduled release of March 2021 passenger airline employment data for May 17.