
First Quarter 2021 Air Fare Drops As Passenger Numbers Increase
BTS 45-21
Contact: BTSNews@dot.gov
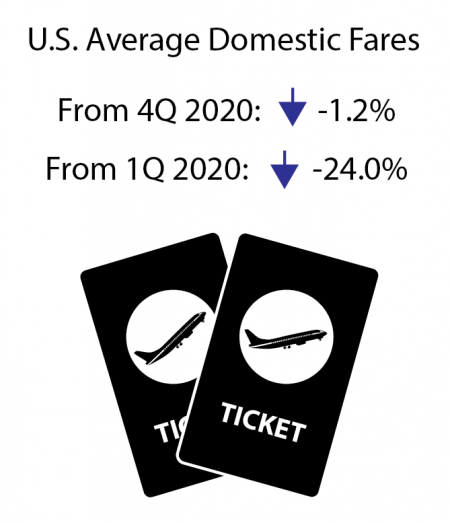
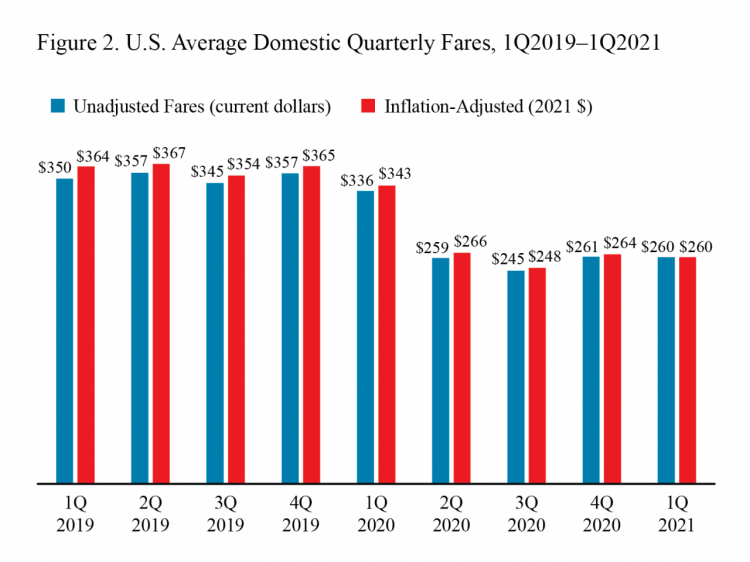
The average U.S. domestic air fare declined in the first quarter of 2021 to $260, down 1.2% from the inflation-adjusted fare of $264 in the fourth quarter of 2020. The first quarter fare of $260 was up 5.0% from the lowest inflation adjusted fare of $248 in the third quarter of 2020.
Adjusted for inflation (constant 2021 dollars) the average 1Q 2021 air fare was:
- Down 24.0% from 1Q 2020 ($343)
- Down 1.2% from 4Q 2020 ($264)
- Down 34.7% from 1Q 2016 ($398)
Air fares declined as passenger demand decreased. U.S. airlines reported 33.4 million originating passengers in the first quarter 2021, down from 60.8 million passengers a year earlier.
Itinerary Fares: Round-trips, but includes one-way tickets if no return is purchased.
Breakout of trip types: one-way, 43% ($205); round-trip, 57% ($305).
Fare calculations by BTS
*Based on a random sample of approximately 10% of tickets sold.
Total ticket value: The price charged by airlines at time of ticket purchase.
Included: Additional taxes and fees levied by an outside entity at time of ticket purchase.
Not included: Fees for optional services, such as baggage fees.
Inflation-Adjusted Average Air Fares
First Quarter 2021 fare ($260):
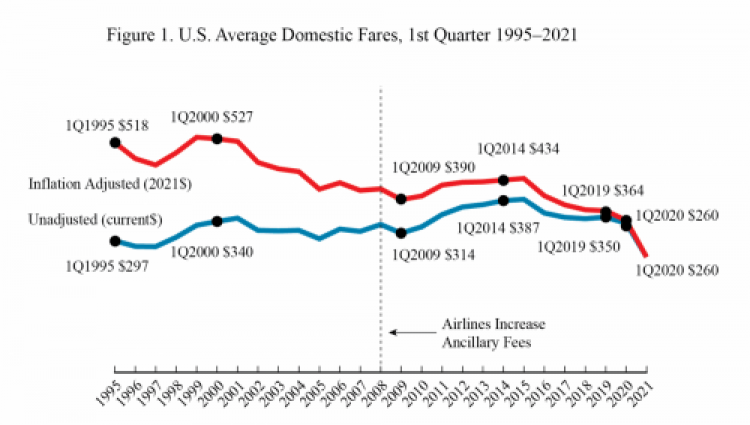
Compared to all first quarters: Down 50.9% from the highest 1Q fare, $530 in 1999.
Compared to all quarters: Down 50.9% from the highest fare for any quarter, $530 in 1Q 1999.
Start of BTS records: Down 49.7% from 1Q 1995 ($518).
Recent high: Down 34.7% from 1Q 2016 ($398).
Recent low: Up 5.0% from 3Q 2020 ($248).
All-time low: Up 5.0% from the previous low 3Q 2020 ($248).
All-time first-quarter low: Down 24.0% from the previous low 1Q 2020 ($343).
Other Revenue: In recent years, airlines have increasingly obtained additional revenue from passenger fees, as well as from other sources. U.S. passenger airlines collected 58.5% of total operating revenue of $10.4 billion from passenger fares during the first three months of 2021, down from 88.5% in 1990.
Unadjusted Average Air Fares
First Quarter 2021 fare ($260)
Trend: Down 0.2% from 4Q 2020 ($261)
Compared to all first quarters: Down 33.3% from the highest 1Q fare, $390 in 2015
Compared to all quarters: Down 35.3% from the highest fare for any quarter, $402 in 2Q 2014
Start of BTS records: Down 12.3% from 1Q 1995 ($297) (compared to 74.4% consumer price increase)
Recent low: Up 6.3% from 3Q 2020 ($245)
Recent high: Down 27.6% from 1Q 2016 ($359)
All-time low: Up 6.3% from 3Q 2020 ($245)
All-time first-quarter low: Down 8.1% from 1Q 1997 ($283).
Fares by Airport
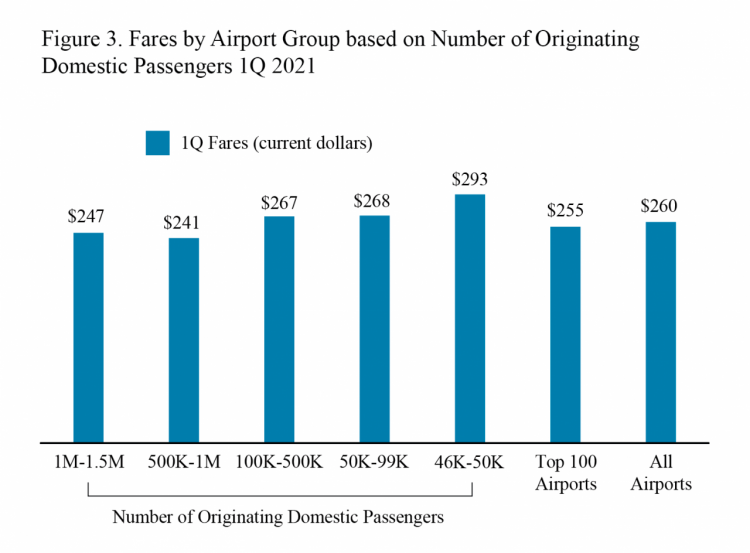
Fares by airport group:
Highest: three airports with 46,000-49,999 originating passengers ($293)
Lowest: 16 airports with 500,000-999,999 originating passengers ($241)
Additional data: see Top 100 Airports or All Airports. Second Quarter 2021 average fare data will be released Oct. 19.
Standard error: Results for average fares are based on the BTS Origin & Destination Survey, a 10% sample of airline tickets used during the quarter. Averages for airports with smaller samples may be less reliable.
Note: Results for average fares are based on the BTS Origin & Destination Survey, a 10% sample of airline tickets used during the quarter. For Q1 2021 results based on all itinerary fares, the standard error is 0.34 and the median fare is $205.84. The 90% confidence interval ranges from $259.76 to 260.86. For results based on round-trip fares, the standard error is .57 and the median fare is $255.08. The 90% confidence interval ranges from $303.99 to $305.88. For results based on one-way fares, the standard error is .36 and the median fare is $162.73. The 90% confidence interval ranges from $204.74 to $205.91.