
Freight Shipments Fell 2.8% in January from December
Five Years: Freight Transportation Services Index, January 2009 - January 2014
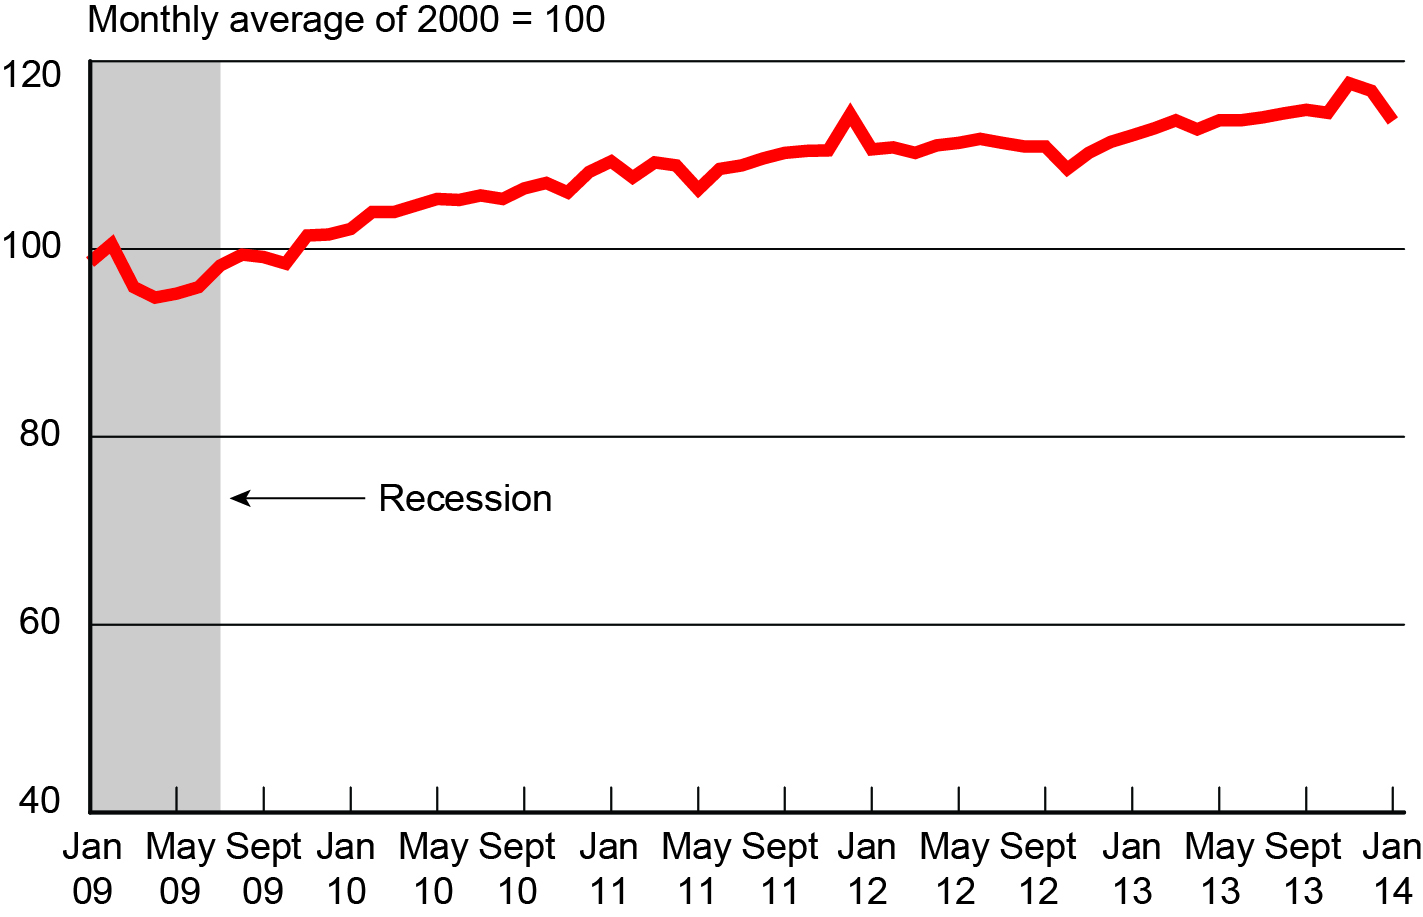
Source for Recession Dates: National Bureau of Economic Research, US Business Cycle Expansions and Contractions
The amount of freight carried by the for-hire transportation industry fell 2.8 percent in January from December, declining for the second consecutive month, according to the U.S. Department of Transportation’s Bureau of Transportation Statistics’ (BTS) Freight Transportation Services Index (TSI) released today. The January 2014 index level (113.6) was 19.8 percent above the April 2009 low during the most recent recession (Tables 1, 2, and 2A).
BTS reported that the level of freight shipments in January measured by the Freight TSI (113.6) was 3.5 percent below the all-time high level of 117.6 in November 2013 (Table 2A). BTS’ TSI records begin in 2000. See historical TSI data.
The December index was revised to 116.8 from 116.5 in last month’s release. Monthly numbers for all of 2013 were revised slightly. Numbers for previous years were also revised.
Beginning with the April release, BTS improved procedures and refined the TSI methodology. As a result there have been minor changes in monthly numbers released previously. Documentation will be made available in the near future.
The Freight TSI measures the month-to-month changes in freight shipments by mode of transportation in tons and ton-miles, which are combined into one index. The index measures the output of the for-hire freight transportation industry and consists of data from for-hire trucking, rail, inland waterways, pipelines and air freight.
Analysis: The index for each freight mode declined in January with the largest decline in trucking. These declines took place during a period of severe winter weather, which particularly hit the heavily populated parts of the country. Severe weather can affect the demand for goods to ship as well as the ability to move goods. The decline in freight TSI took place despite increases in employment and personal income in January. The Federal Reserve Board Industrial Production Index declined in January, with the Construction sector leading the decline.
Trend: The freight TSI declined for the second month in a row, the first time it has fallen for two consecutive months since October 2012. It is at its lowest point since April 2013 but remains higher than in any month prior to March 2013, except for its previous high of December 2011. After dipping to 94.8 in April 2009, the index rose by 19.8 percent in the succeeding 57 months. For additional historical data, go to TSI data.
Index highs and lows: Freight shipments in January 2014 (113.6) were 19.8 percent higher than the recent low in April 2009 during the recession (94.8). The January 2014 level is down 3.5 percent from the historic peak reached in November 2013 (117.6).
Year to date: Freight shipments measured by the index were down 2.8 percent in January compared to the end of 2013 (Table 3)
Long-term trend: Freight shipments are up 15.2 percent in the five years from the recession level of January 2009 and are up 5.3 percent in the 10 years from January 2004 (Table 5).
Same month of previous year: January 2014 freight shipments were up 1.3 percent from January 2013 (Tables 4, 5).
The TSI has three seasonally adjusted indexes that measures changes from the monthly average of the base year of 2000. The three indexes are freight shipments, passenger travel and a combined measure that merges the freight and passenger indexes. TSI includes data from 2000 to the present. Release of the February index is scheduled for April 9.
Passenger Index: The TSI for passengers rose 0.2 percent in January from its December level (Table 6). The Passenger TSI January 2014 level of 118.1 was 1.2 percent above the January 2013 level (Table 7). The index is up 7.6 percent in five years and up 18.4 percent in 10 years (Table 5). The passenger TSI measures the month-to-month changes in travel that involves the services of the for-hire passenger transportation sector. The seasonally adjusted index consists of data from air, local transit and intercity rail.
Combined Index: The combined freight and passenger TSI fell 1.9 percent in January from its December level (Table 8). The combined TSI January 2014 level of 115.0 was 1.3 percent above the January 2013 level (Table 9). The combined index is up 12.8 percent in five years and up 8.9 percent in 10 years (Table 5). The combined TSI merges the freight and passenger indexes into a single index.
Revisions: Monthly data has changed from previous releases due to the use of concurrent seasonal analysis, which results in seasonal analysis factors changing as each months data are added.
For a video explanation of the TSI, see Overview of the Transportation Services Index. A BTS report explaining the TSI, Transportation Services Index and the Economy, is available for download.
Table 1: Freight, Passenger and Combined Transportation Services Indexes Since July 2013
Percent Change from Previous Month
(Seasonally Adjusted, Monthly Average of 2000 = 100)
| Freight | Passenger | Combined | ||||
|---|---|---|---|---|---|---|
| Index | Pct. Change | Index | Pct. Change | Index | Pct. Change | |
| July | 114.0 | 0.2 | 117.1 | -0.6 | 115.0 | 0.0 |
| August | 114.4 | 0.3 | 117.9 | 0.7 | 115.5 | 0.5 |
| September | 114.8 | 0.3 | 117.5 | -0.4 | 115.6 | 0.1 |
| October | 114.5 | -0.2 | 117.9 | 0.4 | 115.6 | 0.0 |
| November | 117.6 | 2.7 | 118.2 | 0.3 | 117.9 | 2.0 |
| December | 116.8 | -0.7 | 117.8 | -0.3 | 117.2 | -0.6 |
| January | 113.6 | -2.8 | 118.1 | 0.2 | 115.0 | -1.9 |
SOURCE: Bureau of Transportation Statistics
NOTE: Percent changes based on numbers prior to rounding.
Table 2: Freight Transportation Services Index Monthly Changes, 2011-2014
Percent change from previous month
| 2011 % Change | 2012 % Change | 2013 % Change | 2014 % Change | |
|---|---|---|---|---|
| January | 1.0 | -3.3 | 0.6 | -2.8 |
| February | -1.5 | 0.2 | 0.7 | |
| March | 1.5 | -0.6 | 0.8 | |
| April | -0.3 | 0.7 | -0.9 | |
| May | -2.4 | 0.3 | 1.0 | |
| June | 2.1 | 0.3 | 0.0 | |
| July | 0.4 | -0.3 | 0.2 | |
| August | 0.6 | -0.3 | 0.3 | |
| September | 0.5 | 0.0 | 0.3 | |
| October | 0.2 | -2.2 | -0.2 | |
| November | 0.1 | 1.5 | 2.7 | |
| December | 3.5 | 1.1 | -0.7 |
SOURCE: Bureau of Transportation Statistics
Table 2A: Freight Transportation Services Index by Month, 2011-2014
| 2011 | 2012 | 2013 | 2014 | |
|---|---|---|---|---|
| January | 109.3 | 110.6 | 112.1 | 113.6 |
| February | 107.6 | 110.8 | 112.8 | |
| March | 109.2 | 110.2 | 113.7 | |
| April | 108.9 | 111.0 | 112.7 | |
| May | 106.3 | 111.3 | 113.7 | |
| June | 108.5 | 111.7 | 113.7 | |
| July | 108.9 | 111.3 | 114.0 | |
| August | 109.6 | 110.9 | 114.4 | |
| September | 110.2 | 110.9 | 114.8 | |
| October | 110.4 | 108.5 | 114.5 | |
| November | 110.5 | 110.2 | 117.6 | |
| December | 114.3 | 111.4 | 116.8 |
SOURCE: Bureau of Transportation Statistics
Table 3: Freight, Passenger and Combined Transportation Services Indexes Year-to-Date Change, 2005-2014
Percent change to January from December of the previous year
| Year | Freight | Passenger | Combined |
|---|---|---|---|
| 2005 | 2.8 | 1.1 | 2.3 |
| 2006 | 0.3 | 1.4 | 0.6 |
| 2007 | -0.9 | 0.2 | -0.6 |
| 2008 | 2.1 | 0.3 | 1.6 |
| 2009 | -1.7 | -0.6 | -1.4 |
| 2010 | 0.6 | 0.4 | 0.5 |
| 2011 | 1.0 | 0.4 | 0.8 |
| 2012 | -3.3 | -1.0 | -2.6 |
| 2013 | 0.6 | 0.5 | 0.6 |
| 2014 | -2.8 | 0.2 | -1.9 |
SOURCE: Bureau of Transportation Statistics
Table 4: Freight Transportation Services Index from Year-to-Year
Percent change in the January Freight TSI
(Monthly average of 2000 = 100)
| January Freight TSI | Percent change from same month previous year | |
|---|---|---|
| 2005 | 114.2 | 6.0 |
| 2006 | 112.5 | -1.5 |
| 2007 | 109.6 | -2.5 |
| 2008 | 113.1 | 3.2 |
| 2009 | 98.6 | -12.8 |
| 2010 | 102.1 | 3.6 |
| 2011 | 109.3 | 7.0 |
| 2012 | 110.6 | 1.2 |
| 2013 | 112.1 | 1.4 |
| 2014 | 113.6 | 1.3 |
SOURCE: Bureau of Transportation Statistics
NOTE: Percent changes based on numbers prior to rounding.
Table 5: Transportation Services Indexes from Previous Years
Percent Change to 2014 (January to January)
| Since January . . . | Duration in years | Freight TSI Percent change to January 2014 | Passenger TSI Percent change to January 2014 | Combined TSI Percent change to January 2014 |
|---|---|---|---|---|
| 2013 | 1 | 1.3 | 1.2 | 1.3 |
| 2012 | 2 | 2.7 | 2.6 | 2.7 |
| 2011 | 3 | 3.9 | 3.9 | 3.9 |
| 2010 | 4 | 11.2 | 6.4 | 9.7 |
| 2009 | 5 | 15.2 | 7.6 | 12.8 |
| 2008 | 6 | 0.4 | 1.2 | 0.5 |
| 2007 | 7 | 3.6 | 3.7 | 3.5 |
| 2006 | 8 | 0.9 | 7.1 | 2.6 |
| 2005 | 9 | -0.6 | 9.7 | 2.2 |
| 2004 | 10 | 5.3 | 18.4 | 8.9 |
SOURCE: Bureau of Transportation Statistics
Table 6: Passenger Transportation Services Index Monthly Changes, 2011-2014
Percent change from previous month
| 2011 % Change | 2012 % Change | 2013 % Change | 2014 % Change | |
|---|---|---|---|---|
| January | 0.4 | -1.0 | 0.5 | 0.2 |
| February | -1.4 | 1.4 | -0.3 | |
| March | 1.8 | -0.1 | -0.2 | |
| April | 0.1 | -0.4 | 1.2 | |
| May | 1.1 | -0.4 | 0.0 | |
| June | -0.7 | 0.0 | 0.1 | |
| July | 1.0 | -0.6 | -0.6 | |
| August | -2.3 | 1.0 | 0.7 | |
| September | 2.4 | -0.2 | -0.4 | |
| October | -0.1 | -1.5 | 0.4 | |
| November | 0.0 | 0.5 | 0.3 | |
| December | 0.6 | 1.3 | -0.3 |
SOURCE: Bureau of Transportation Statistics
Table 7: Passenger Transportation Services Index from Year-to-Year
Percent change in the January Passenger TSI
(Monthly average of 2000 = 100)
| January Passenger TSI | Percent change from same month previous year | |
|---|---|---|
| 2005 | 107.6 | 7.9 |
| 2006 | 110.2 | 2.4 |
| 2007 | 113.9 | 3.3 |
| 2008 | 116.7 | 2.4 |
| 2009 | 109.7 | -5.9 |
| 2010 | 111.0 | 1.1 |
| 2011 | 113.6 | 2.4 |
| 2012 | 115.1 | 1.3 |
| 2013 | 116.7 | 1.4 |
| 2014 | 118.1 | 1.2 |
SOURCE: Bureau of Transportation Statistics
NOTE: Percent changes based on numbers prior to rounding.
Table 8: Combined Transportation Services Index Monthly Changes, 2011-2014
Percent change from previous month
| 2011 % Change | 2012 % Change | 2013 % Change | 2014 % Change | |
|---|---|---|---|---|
| January | 0.8 | -2.6 | 0.6 | -1.9 |
| February | -1.5 | 0.6 | 0.4 | |
| March | 1.6 | -0.5 | 0.5 | |
| April | -0.2 | 0.4 | -0.3 | |
| May | -1.3 | 0.1 | 0.7 | |
| June | 1.3 | 0.2 | 0.0 | |
| July | 0.6 | -0.4 | 0.0 | |
| August | -0.3 | 0.1 | 0.5 | |
| September | 1.1 | -0.1 | 0.1 | |
| October | 0.1 | -2.0 | 0.0 | |
| November | 0.1 | 1.2 | 2.0 | |
| December | 2.6 | 1.2 | -0.6 |
SOURCE: Bureau of Transportation Statistics
Table 9: Combined Transportation Services Index from Year-to-Year
Percent change in the January Combined TSI
(Monthly average of 2000 = 100)
| January Combined TSI | Percent change from same month previous year | |
|---|---|---|
| 2005 | 112.5 | 6.6 |
| 2006 | 112.1 | -0.4 |
| 2007 | 111.1 | -0.9 |
| 2008 | 114.4 | 3.0 |
| 2009 | 101.9 | -10.9 |
| 2010 | 104.8 | 2.8 |
| 2011 | 110.6 | 5.6 |
| 2012 | 112.0 | 1.2 |
| 2013 | 113.6 | 1.4 |
| 2014 | 115.0 | 1.3 |
SOURCE: Bureau of Transportation Statistics
NOTE: Percent changes based on numbers prior to rounding.