


Freight Shipments Rose 0.8% in September from August
Five Years: Freight Transportation Services Index, September 2008-September 2013
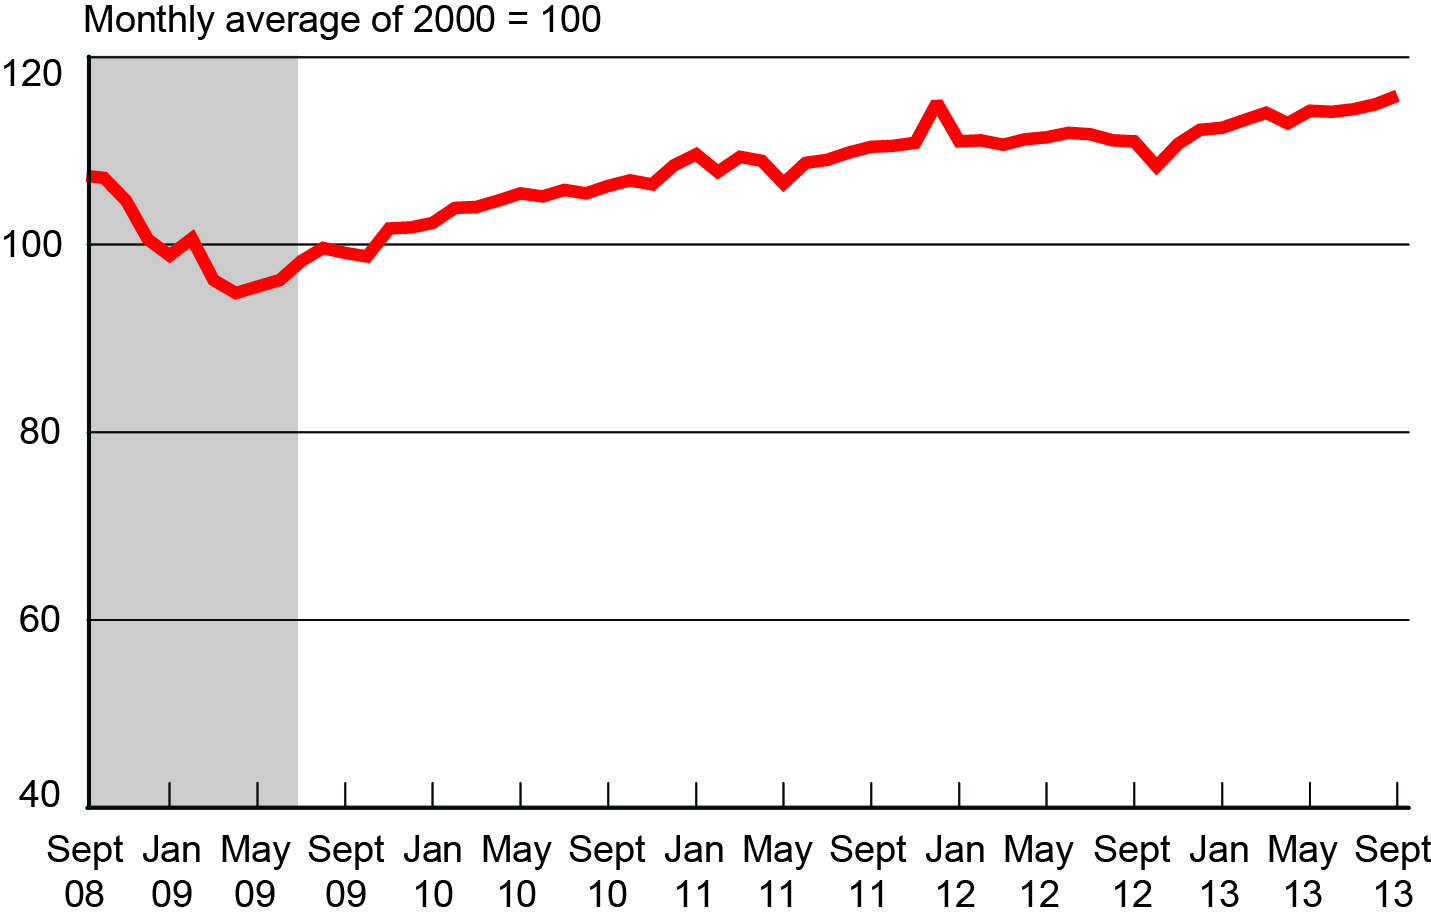
Source for Recession Dates: National Bureau of Economic Research, US Business Cycle Expansions and Contractions
The amount of freight carried by the for-hire transportation industry rose 0.8 percent in September from August, rising for the third consecutive month to reach its highest all-time level, according to the U.S. Department of Transportation’s Bureau of Transportation Statistics’ (BTS) Freight Transportation Services Index (TSI) released today. The September 2013 index level (115.8) was 22.1 percent above the April 2009 low during the most recent recession (Tables 1, 2, and 2A).
BTS, a part of the Research and Innovative Technology Administration, reported that in reaching the all-time high of 115.8 in September, the Freight TSI rose 7.0 percent in the 11 months following a dip in October 2012 (Table 2A). BTS’ TSI records begin in 2000. See historical TSI data.
Beginning with the April release, BTS improved procedures and refined the TSI methodology. As a result, there have been minor changes in monthly numbers released previously. Documentation will be made available in the near future. In this release, there were upward revisions of 0.1 in data for March, May, June, July and August 2013 as well as small downward revisions in data for September through December 2012.
The Freight TSI measures the month-to-month changes in freight shipments by mode of transportation in tons and ton-miles, which are combined into one index. The index measures the output of the for-hire freight transportation industry and consists of data from for-hire trucking, rail, inland waterways, pipelines and air freight.
Analysis: The 0.8 percent increase in September freight transportation was driven by increases in all modes except rail carloads. The accelerating growth in each month of the third quarter of 2013 is consistent with Gross Domestic Product (GDP) growth of 2.8 percent during those three months.
The TSI rise has continued since its low point in April 2009 despite some small downturns. The recovery showed growth across all modes, led by rail intermodal and truck. The only mode not to grow since the recession was Inland Waterborne. During the recovery, GDP increased by 10 percent while payroll employment increased somewhat more slowly at 3.8 percent.
Trend: The Freight TSI remained above its 2012 range for the ninth month in a row. Beginning with January, every month in 2013 has exceeded the high point of 2012, 112.2 reached in December. The September 2013 level is the highest TSI freight has been in 2013, and is the highest all-time level. After dipping to 94.8 in April 2009, the index rose 22.1 percent in the succeeding 53 months. For additional historical data, go to TSI data.
Index highs and lows: Freight shipments in September 2013 (115.8) were 22.1 percent higher than the recent low in April 2009 during the recession (94.8). The September 2013 level (115.8) is an all-time high.
Year to date: Freight shipments measured by the index were up 3.2 percent in September compared to the end of 2012 (Table 3)
Long-term trend: Freight shipments are up 7.9 percent in the five years from the recession level of September 2008 and are up 10.4 percent in the 10 years from September 2003 (Table 5).
Same month of previous year: September 2013 freight shipments were up 4.3 percent from September 2012 (Tables 4, 5).
3rd quarter changes: The Freight TSI rose 1.6 percent in the first quarter, 0.1 percent in the second quarter, and 1.5 percent in the third quarter of 2013 (Table 10).
The TSI has three seasonally adjusted indexes that measures changes from the monthly average of the base year of 2000. The three indexes are freight shipments, passenger travel and a combined measure that merges the freight and passenger indexes. TSI includes data from 2000 to the present. Release of the October 2013 index is scheduled for December 2013.
For a video explanation of the TSI, see Overview of the Transportation Services Index. A BTS report explaining the TSI, Transportation Services Index and the Economy, is available for download.
Passenger Index: The TSI for passengers remained unchanged in September at its August level (Table 6). The Passenger TSI September 2013 level of 118.0 was 1.7 percent above the September 2012 level (Table 7). The index is up 5.0 percent in five years and up 20.5 percent in 10 years (Table 5). The passenger TSI measures the month-to-month changes in travel that involves the services of the for-hire passenger transportation sector. The seasonally adjusted index consists of data from air, local transit and intercity rail.
Combined Index: The combined freight and passenger TSI rose 0.6 percent in September from its August level (Table 8). The combined TSI September 2013 level of 116.4 was 3.6 percent above the September 2012 level (Table 9). The combined index is up 7.0 percent in five years and up 13.0 percent in 10 years (Table 5). The combined TSI merges the freight and passenger indexes into a single index.
Revisions: Monthly data has changed from previous releases due to the use of concurrent seasonal analysis, which results in seasonal analysis factors changing as each month’s data are added.
Table 1: Freight, Passenger and Combined Transportation Services Indexes Since March 2013
Percent Change from Previous Month
(Seasonally Adjusted, Monthly Average of 2000 = 100)
| Month | Freight Pct. Change | Freight Index | Passenger Pct. Change | Passenger Index | Combined Index | Combined Pct. Change |
|---|---|---|---|---|---|---|
| March | 114.0 | 0.7 | 116.3 | -0.2 | 114.6 | 0.5 |
| April | 112.9 | -0.9 | 117.7 | 1.2 | 114.3 | -0.3 |
| May | 114.2 | 1.1 | 117.7 | 0.0 | 115.2 | 0.8 |
| June | 114.1 | -0.1 | 117.9 | 0.1 | 115.2 | 0.0 |
| July | 114.4 | 0.3 | 117.5 | -0.3 | 115.3 | 0.1 |
| August | 114.9 | 0.4 | 118.0 | 0.4 | 115.8 | 0.4 |
| September | 115.8 | 0.8 | 118.0 | 0.0 | 116.4 | 0.6 |
SOURCE: Bureau of Transportation Statistics
NOTE: Percent changes based on numbers prior to rounding.
Table 2: Freight Transportation Services Index Monthly Changes, 2010-2013
Percent change from previous month
| Month | 2010 % Change | 2011 % Change | 2012 % Change | 2013 % Change |
|---|---|---|---|---|
| January | 0.5 | 1.1 | -3.5 | 0.2 |
| February | 1.6 | -1.7 | 0.1 | 0.7 |
| March | 0.0 | 1.5 | -0.5 | 0.7 |
| April | 0.7 | -0.4 | 0.6 | -0.9 |
| May | 0.6 | -2.2 | 0.2 | 1.1 |
| June | -0.2 | 2.1 | 0.4 | -0.1 |
| July | 0.6 | 0.2 | -0.2 | 0.3 |
| August | -0.4 | 0.7 | -0.5 | 0.4 |
| September | 0.8 | 0.6 | -0.1 | 0.8 |
| October | 0.5 | 0.1 | -2.4 | - |
| November | -0.3 | 0.3 | 2.3 | - |
| December | 1.9 | 3.9 | 1.3 | - |
SOURCE: Bureau of Transportation Statistics
Table 2A: Freight Transportation Services Index by Month, 2010-2013
| Month | 2010 | 2011 | 2012 | 2013 |
|---|---|---|---|---|
| January | 102.3 | 109.6 | 111.0 | 112.4 |
| February | 103.9 | 107.7 | 111.1 | 113.2 |
| March | 104.0 | 109.3 | 110.6 | 114.0 |
| April | 104.7 | 108.9 | 111.2 | 112.9 |
| May | 105.4 | 106.5 | 111.4 | 114.2 |
| June | 105.1 | 108.7 | 111.9 | 114.1 |
| July | 105.8 | 109.0 | 111.7 | 114.4 |
| August | 105.4 | 109.8 | 111.1 | 114.9 |
| September | 106.2 | 110.4 | 111.0 | 115.8 |
| October | 106.8 | 110.5 | 108.3 | - |
| November | 106.4 | 110.8 | 110.7 | - |
| December | 108.4 | 115.1 | 112.2 | - |
SOURCE: Bureau of Transportation Statistics
Table 3: Freight, Passenger and Combined Transportation Services Indexes Year-to-Date Change, 2004-2013
Percent change to September from December of the previous year
| Year | Freight | Passenger | Combined |
|---|---|---|---|
| 2004 | 2.2 | 4.1 | 2.7 |
| 2005 | 0.5 | 3.7 | 1.4 |
| 2006 | 0.5 | 1.8 | 0.9 |
| 2007 | -1.0 | 3.5 | 0.2 |
| 2008 | -3.2 | -3.6 | -3.3 |
| 2009 | -1.4 | -0.7 | -1.2 |
| 2010 | 4.4 | 3.0 | 4.0 |
| 2011 | 1.8 | 2.3 | 2.0 |
| 2012 | -3.6 | -0.3 | -2.7 |
| 2013 | 3.2 | 1.7 | 2.8 |
SOURCE: Bureau of Transportation Statistics
Table 4: Freight Transportation Services Index from Year-to-Year
Percent change in the September Freight TSI
(Monthly average of 2000 = 100)
| Year | September Freight TSI | Percent change from same month previous year |
|---|---|---|
| 2004 | 110.4 | 5.2 |
| 2005 | 111.5 | 1.0 |
| 2006 | 112.8 | 1.2 |
| 2007 | 109.3 | -3.1 |
| 2008 | 107.3 | -1.8 |
| 2009 | 99.1 | -7.6 |
| 2010 | 106.2 | 7.2 |
| 2011 | 110.4 | 3.9 |
| 2012 | 111.0 | 0.5 |
| 2013 | 115.8 | 4.3 |
SOURCE: Bureau of Transportation Statistics
NOTE: Percent changes based on numbers prior to rounding.
Table 5: Transportation Services Indexes from Previous Years
Percent Change to 2013 (September to September)
| Since September . . . | Duration in years | Freight TSI Percent change to September 2013 | Passenger TSI Percent change to September 2013 | Combined TSI Percent change to September 2013 |
|---|---|---|---|---|
| 2012 | 1 | 4.3 | 1.7 | 3.6 |
| 2011 | 2 | 4.9 | 1.9 | 4.0 |
| 2010 | 3 | 9.0 | 3.5 | 7.4 |
| 2009 | 4 | 16.8 | 7.5 | 14.0 |
| 2008 | 5 | 7.9 | 5.0 | 7.0 |
| 2007 | 6 | 5.9 | 0.1 | 4.2 |
| 2006 | 7 | 2.7 | 6.2 | 3.5 |
| 2005 | 8 | 3.9 | 6.5 | 4.5 |
| 2004 | 9 | 4.9 | 12.9 | 6.9 |
| 2003 | 10 | 10.4 | 20.5 | 13.0 |
SOURCE: Bureau of Transportation Statistics
Table 6: Passenger Transportation Services Index Monthly Changes, 2010-2013
Percent change from previous month
| Month | 2010 % Change | 2011 % Change | 2012 % Change | 2013 % Change |
|---|---|---|---|---|
| January | 0.3 | 0.4 | -1.1 | 0.5 |
| February | -2.5 | -1.4 | 1.5 | -0.2 |
| March | 2.9 | 1.8 | -0.1 | -0.2 |
| April | -0.5 | 0.1 | -0.4 | 1.2 |
| May | 0.5 | 1.1 | -0.4 | 0.0 |
| June | 0.9 | -0.6 | 0.0 | 0.1 |
| July | 0.1 | 0.9 | -0.6 | -0.3 |
| August | -0.1 | -2.2 | 1.3 | 0.4 |
| September | 1.3 | 2.3 | -0.4 | 0.0 |
| October | 1.5 | -0.1 | -1.6 | |
| November | -1.1 | 0.0 | 0.6 | |
| December | -1.1 | 0.5 | 1.1 |
SOURCE: Bureau of Transportation Statistics
Table 7: Passenger Transportation Services Index from Year-to-Year
Percent change in the September Passenger TSI
(Monthly average of 2000 = 100)
| Year | September Passenger TSI | Percent change from same month previous year |
|---|---|---|
| 2004 | 104.5 | 6.7 |
| 2005 | 110.8 | 6.0 |
| 2006 | 111.1 | 0.2 |
| 2007 | 117.9 | 6.2 |
| 2008 | 112.4 | -4.7 |
| 2009 | 109.7 | -2.3 |
| 2010 | 114.0 | 3.9 |
| 2011 | 115.8 | 1.6 |
| 2012 | 116.0 | 0.1 |
| 2013 | 118.0 | 1.7 |
SOURCE: Bureau of Transportation Statistics
NOTE: Percent changes based on numbers prior to rounding.
Table 8: Combined Transportation Services Index Monthly Changes, 2010-2013
Percent change from previous month
| Month | 2010 % Change | 2011 % Change | 2012 % Change | 2013 % Change |
|---|---|---|---|---|
| January | 0.5 | 0.9 | -2.9 | 0.3 |
| February | 0.4 | -1.6 | 0.5 | 0.4 |
| March | 0.9 | 1.6 | -0.4 | 0.5 |
| April | 0.4 | -0.3 | 0.3 | -0.3 |
| May | 0.6 | -1.3 | 0.0 | 0.8 |
| June | 0.1 | 1.3 | 0.3 | 0.0 |
| July | 0.5 | 0.4 | -0.3 | 0.1 |
| August | -0.3 | -0.1 | 0.0 | 0.4 |
| September | 1.0 | 1.0 | -0.2 | 0.6 |
| October | 0.8 | 0.0 | -2.2 | |
| November | -0.6 | 0.2 | 1.8 | |
| December | 1.0 | 2.9 | 1.2 |
SOURCE: Bureau of Transportation Statistics
Table 9: Combined Transportation Services Index from Year-to-Year
Percent change in the September Combined TSI
(Monthly average of 2000 = 100)
| Year | September Combined TSI | Percent change from same month previous year |
|---|---|---|
| 2004 | 108.9 | 5.7 |
| 2005 | 111.5 | 2.4 |
| 2006 | 112.5 | 0.9 |
| 2007 | 111.8 | -0.6 |
| 2008 | 108.9 | -2.6 |
| 2009 | 102.1 | -6.2 |
| 2010 | 108.4 | 6.2 |
| 2011 | 111.9 | 3.2 |
| 2012 | 112.4 | 0.4 |
| 2013 | 116.4 | 3.6 |
SOURCE: Bureau of Transportation Statistics
NOTE: Percent changes based on numbers prior to rounding.
Table 10: Freight Transportation Services Index Change by Quarter, 2004-2013
Percent change from the last month of the previous quarter
| Year | 1st Quarter (Jan-Mar) % Growth | 2nd Quarter (Apr-Jun) % Growth | 3rd Quarter (Jul-Sep) % Growth | 4th Quarter (Oct-Dec) % Growth |
|---|---|---|---|---|
| 2004 | 1.9 | 0.6 | -0.2 | 0.5 |
| 2005 | 1.0 | -0.5 | -0.1 | 0.6 |
| 2006 | -0.4 | 1.1 | -0.2 | -2.1 |
| 2007 | 1.3 | -2.1 | -0.3 | 1.4 |
| 2008 | -0.4 | -0.1 | -2.6 | -6.4 |
| 2009 | -4.3 | 0.1 | 3.0 | 2.7 |
| 2010 | 2.2 | 1.1 | 1.1 | 2.0 |
| 2011 | 0.9 | -0.6 | 1.5 | 4.3 |
| 2012 | -3.9 | 1.2 | -0.8 | 1.1 |
| 2013 | 1.6 | 0.1 | 1.5 | - |
SOURCE: Bureau of Transportation Statistics
Table 11: Passenger Transportation Services Index Change by Quarter, 2004-2013
Percent change from the last month of the previous quarter
| Year | 1st Quarter (Jan-Mar) % Growth | 2nd Quarter (Apr-Jun) % Growth | 3rd Quarter (Jul-Sep) % Growth | 4th Quarter (Oct-Dec) % Growth |
|---|---|---|---|---|
| 2004 | 2.1 | 1.8 | 0.1 | 2.2 |
| 2005 | 1.3 | 0.8 | 1.6 | -1.5 |
| 2006 | 2.0 | -0.1 | -0.2 | 2.6 |
| 2007 | 2.6 | 0.0 | 0.9 | -1.1 |
| 2008 | 0.1 | 0.0 | -3.7 | -1.7 |
| 2009 | -1.7 | 0.1 | 1.0 | 0.9 |
| 2010 | 0.7 | 0.9 | 1.3 | -0.7 |
| 2011 | 0.8 | 0.5 | 1.0 | 0.4 |
| 2012 | 0.3 | -0.8 | 0.2 | 0.1 |
| 2013 | 0.2 | 1.4 | 0.1 | - |
SOURCE: Bureau of Transportation Statistics
Table 12: Combined Transportation Services Index Change by Quarter, 2004-2013
Percent change from the last month of the previous quarter
| Year | 1st Quarter (Jan-Mar) % Growth | 2nd Quarter (Apr-Jun) % Growth | 3rd Quarter (Jul-Sep) % Growth | 4th Quarter (Oct-Dec) % Growth |
|---|---|---|---|---|
| 2004 | 1.9 | 0.9 | -0.1 | 1.0 |
| 2005 | 1.1 | -0.1 | 0.4 | 0.0 |
| 2006 | 0.3 | 0.8 | -0.2 | -0.8 |
| 2007 | 1.7 | -1.5 | 0.0 | 0.7 |
| 2008 | -0.3 | -0.1 | -2.9 | -5.1 |
| 2009 | -3.6 | 0.1 | 2.4 | 2.1 |
| 2010 | 1.7 | 1.0 | 1.1 | 1.2 |
| 2011 | 0.8 | -0.2 | 1.4 | 3.2 |
| 2012 | -2.7 | 0.6 | -0.5 | 0.8 |
| 2013 | 1.2 | 0.5 | 1.1 | - |
SOURCE: Bureau of Transportation Statistics
Brief Explanation of the TSI
The Transportation Services Index (TSI) is a measure of the month-to-month changes in the output of services provided by the for-hire transportation industries. The freight index measure changes in freight shipments while the passenger index measures changes in passenger travel.
The TSI tells us how the output of transportation services has increased or decreased from month to month. The index can be examined together with other economic indicators to produce a better understanding of the current and future course of the economy. The movement of the index over time can be compared with other economic measures to understand the relationship of changes in transportation output to changes in Gross Domestic Product (GDP).
The freight transportation index consists of:
For-hire trucking,
Railroad freight services (including rail based intermodal shipments such as
containers on flat cars),
Inland waterways transportation,
Pipeline transportation (including principally petroleum and petroleum products
and natural gas), and
Air freight.
The index does not include international or coastal waterborne movements, private trucking, courier services, or the US Postal Service.
The passenger transportation index consists of:
Local transit,
Intercity passenger rail, and
Passenger air transportation.
The index does not include intercity bus, sight seeing services, ferry services, taxi service, private automobile usage, or bicycling and other non-motorized transportation.