
Freight Shipments Rose 1.2% in February from January
Five Years: Freight Transportation Services Index, February 2009- February 2014
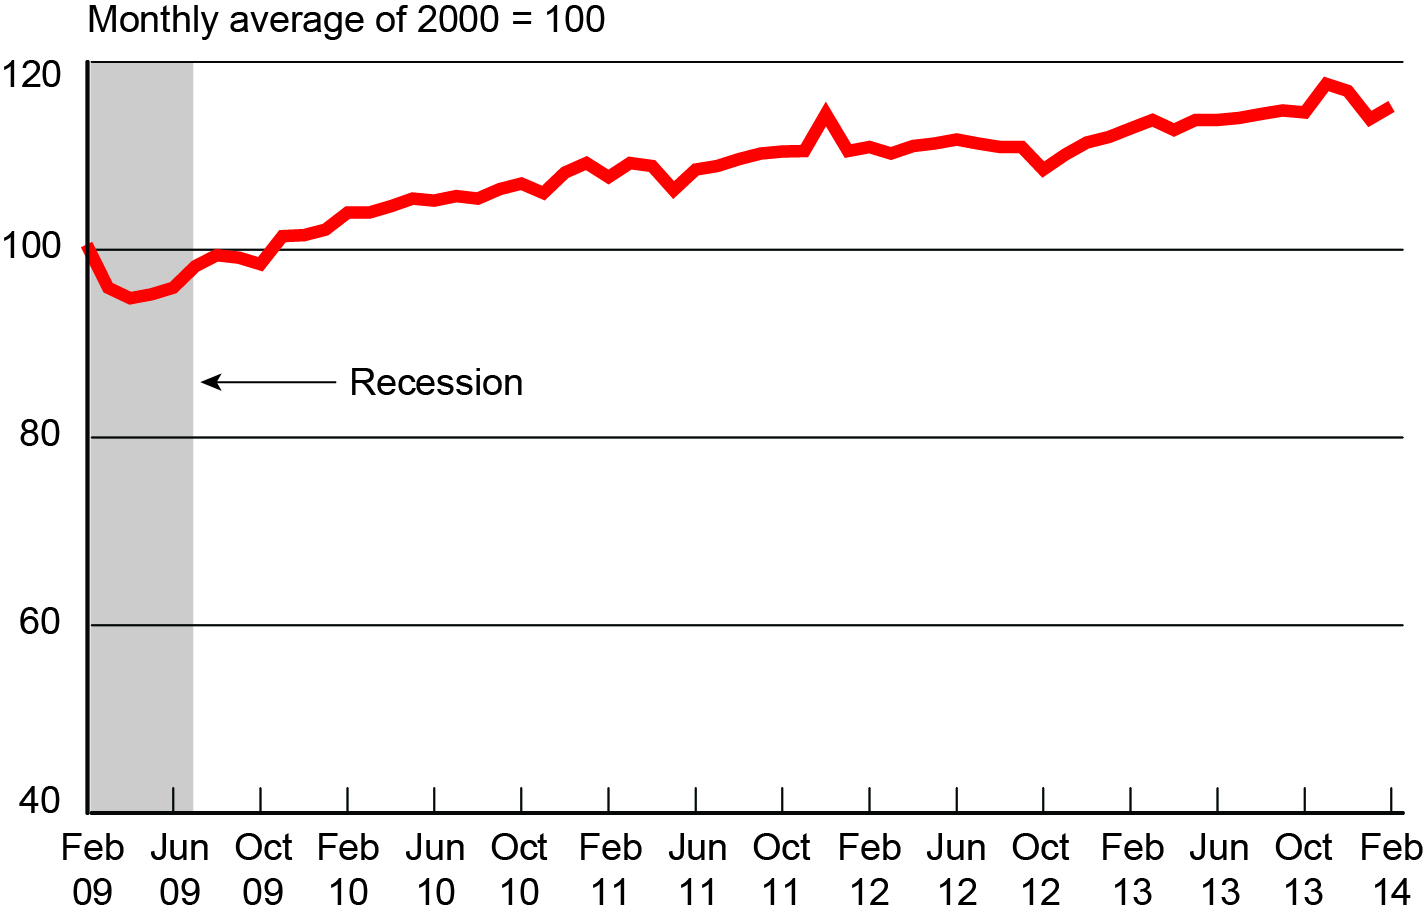
Source for Recession Dates: National Bureau of Economic Research, US Business Cycle Expansions and Contractions
The amount of freight carried by the for-hire transportation industry rose 1.2 percent in February from January, rising after two consecutive monthly declines, according to the U.S. Department of Transportation’s Bureau of Transportation Statistics’ (BTS) Freight Transportation Services Index (TSI) released today. The February 2014 index level (115.2) was 21.6 percent above the April 2009 low during the most recent recession (Tables 1, 2, and 2A).
The level of freight shipments in February measured by the Freight TSI (115.2) was two percent below the all-time high level of 117.6 in November 2013 (Table 2A). BTS’ TSI records begin in 2000. See historical TSI data.
The January index was revised to 113.9 from 113.6 in last month’s release. The December index was also revised up.
The Freight TSI measures the month-to-month changes in freight shipments by mode of transportation in tons and ton-miles, which are combined into one index. The index measures the output of the for-hire freight transportation industry and consists of data from for-hire trucking, rail, inland waterways, pipelines and air freight.
Analysis: The February rebound in the freight index was dominated by trucking and rail intermodal as the other freight modes declined or were stable. The unusually severe weather that hampered freight shipments in January continued in February but the demand for goods to ship increased despite the weather. The Federal Reserve Board Industrial Production Index, which had declined in the face of January’s severe weather, rebounded in February.
Trend: The freight TSI increased after declining for two consecutive months. While still below the all-time high reached in November 2013, it is at the third highest level ever and higher than at any time prior to that month. After dipping to 94.8 in April 2009, the index rose by 21.6 percent in the succeeding 58 months. For additional historical data, go to TSI data.
Index highs and lows: Freight shipments in February 2014 (115.2) were 21.6 percent higher than the recent low in April 2009 during the recession (94.8). The February 2014 level is down 2.0 percent from the historic peak reached in November 2013 (117.6).
Year to date: Freight shipments measured by the index were down 1.4 percent in February compared to the end of 2013 (Table 3)
Long-term trend: Freight shipments are up 14.6 percent in the five years from the recession level of February 2009 and are up 5.7 percent in the 10 years from February 2004 (Table 5).
Same month of previous year: February 2014 freight shipments were up 2.1 percent from February 2013 (Tables 4, 5).
The TSI has three seasonally adjusted indexes that measure changes from the monthly average of the base year of 2000. The three indexes are freight shipments, passenger travel and a combined measure that merges the freight and passenger indexes. TSI includes data from 2000 to the present. Release of the March 2014 index is scheduled for May 14.
Passenger Index: The TSI for passengers rose 0.1 percent in February from its January level (Table 6). The Passenger TSI February 2014 level of 118.6 was two percent above the February 2013 level (Table 7). The index is up 7.9 percent in five years and up 14.7 percent in 10 years (Table 5). The passenger TSI measures the month-to-month changes in travel that involves the services of the for-hire passenger transportation sector. The seasonally-adjusted index consists of data from air, local transit and intercity rail.
Combined Index: The combined freight and passenger TSI rose 0.8 percent in February from its January level (Table 8). The combined TSI February 2014 level of 116.3 was 2.1 percent above the February 2013 level (Table 9). The combined index is up 12.5 percent in five years and up 8.2 percent in 10 years (Table 5). The combined TSI merges the freight and passenger indexes into a single index.
Revisions: Monthly data has changed from previous releases due to the use of concurrent seasonal analysis, which results in seasonal analysis factors changing as each months data are added.
For a video explanation of the TSI, see Overview of the Transportation Services Index. A BTS report explaining the TSI, Transportation Services Index and the Economy, is available for download.
Table 1: Freight, Passenger and Combined Transportation Services Indexes Since August 2013
Percent Change from Previous Month
(Seasonally Adjusted, Monthly Average of 2000 = 100)
| Freight | Passenger | Combined | ||||
|---|---|---|---|---|---|---|
| Index | Pct. Change | Index | Pct. Change | Index | Pct. Change | |
| August | 114.4 | 0.4 | 118.0 | 0.7 | 115.5 | 0.5 |
| September | 114.8 | 0.3 | 117.6 | -0.3 | 115.7 | 0.1 |
| October | 114.6 | -0.2 | 118.7 | 1.0 | 115.9 | 0.2 |
| November | 117.6 | 2.6 | 118.7 | 0.0 | 118.0 | 1.8 |
| December | 116.9 | -0.6 | 118.5 | -0.2 | 117.4 | -0.5 |
| January | 113.9 | -2.5 | 118.6 | 0.0 | 115.4 | -1.8 |
| February | 115.2 | 1.2 | 118.6 | 0.1 | 116.3 | 0.8 |
SOURCE: Bureau of Transportation Statistics
NOTE: Percent changes based on numbers prior to rounding.
Table 2: Freight Transportation Services Index Monthly Changes, 2011-2014
Percent change from previous month
| 2011 % Change | 2012 % Change | 2013 % Change | 2014 % Change | |
|---|---|---|---|---|
| January | 1.0 | -3.4 | 0.5 | -2.5 |
| February | -1.4 | 0.4 | 0.8 | 1.2 |
| March | 1.5 | -0.6 | 0.8 | |
| April | -0.3 | 0.7 | -0.9 | |
| May | -2.4 | 0.3 | 1.0 | |
| June | 2.1 | 0.3 | 0.0 | |
| July | 0.4 | -0.4 | 0.2 | |
| August | 0.6 | -0.3 | 0.4 | |
| September | 0.5 | 0.0 | 0.3 | |
| October | 0.2 | -2.2 | -0.2 | |
| November | 0.1 | 1.5 | 2.6 | |
| December | 3.5 | 1.2 | -0.6 |
SOURCE: Bureau of Transportation Statistics
Table 2A: Freight Transportation Services Index by Month, 2011-2014
| 2011 | 2012 | 2013 | 2014 | |
|---|---|---|---|---|
| January | 109.2 | 110.5 | 112.0 | 113.9 |
| February | 107.7 | 110.9 | 112.9 | 115.2 |
| March | 109.2 | 110.2 | 113.8 | |
| April | 108.9 | 111.0 | 112.7 | |
| May | 106.3 | 111.3 | 113.8 | |
| June | 108.5 | 111.7 | 113.8 | |
| July | 108.9 | 111.3 | 114.0 | |
| August | 109.6 | 110.9 | 114.4 | |
| September | 110.2 | 110.9 | 114.8 | |
| October | 110.4 | 108.5 | 114.6 | |
| November | 110.5 | 110.1 | 117.6 | |
| December | 114.4 | 111.4 | 116.9 |
SOURCE: Bureau of Transportation Statistics
Table 3: Freight, Passenger and Combined Transportation Services Indexes Year-to-Date Change, 2005-2014
Percent change to February from December of the previous year
| Year | Freight | Passenger | Combined |
|---|---|---|---|
| 2005 | 1.6 | 1.2 | 1.5 |
| 2006 | -0.6 | 1.2 | -0.1 |
| 2007 | -0.4 | -0.3 | -0.3 |
| 2008 | 0.5 | 1.4 | 0.8 |
| 2009 | 0.3 | -0.4 | 0.1 |
| 2010 | 2.3 | -2.2 | 0.9 |
| 2011 | -0.5 | -1.2 | -0.7 |
| 2012 | -3.1 | 0.2 | -2.1 |
| 2013 | 1.3 | 0.0 | 0.9 |
| 2014 | -1.4 | 0.1 | -0.9 |
SOURCE: Bureau of Transportation Statistics
Table 4: Freight Transportation Services Index from Year-to-Year
Percent change in the February Freight TSI
(Monthly average of 2000 = 100)
| February Freight TSI | Percent change from same month previous year | |
|---|---|---|
| 2005 | 113.0 | 3.7 |
| 2006 | 111.5 | -1.4 |
| 2007 | 110.2 | -1.1 |
| 2008 | 111.4 | 1.1 |
| 2009 | 100.5 | -9.8 |
| 2010 | 103.9 | 3.4 |
| 2011 | 107.7 | 3.6 |
| 2012 | 110.9 | 3.0 |
| 2013 | 112.9 | 1.8 |
| 2014 | 115.2 | 2.1 |
SOURCE: Bureau of Transportation Statistics
NOTE: Percent changes based on numbers prior to rounding.
Table 5: Transportation Services Indexes from Previous Years
Percent Change to 2014 (February to February)
| Since February . . . | Duration in years | Freight TSI Percent change to February 2014 | Passenger TSI Percent change to February 2014 | Combined TSI Percent change to February 2014 |
|---|---|---|---|---|
| 2013 | 1 | 2.1 | 2.0 | 2.1 |
| 2012 | 2 | 4.0 | 1.8 | 3.3 |
| 2011 | 3 | 7.0 | 6.0 | 6.7 |
| 2010 | 4 | 10.9 | 9.7 | 10.5 |
| 2009 | 5 | 14.6 | 7.9 | 12.5 |
| 2008 | 6 | 3.4 | 0.5 | 2.5 |
| 2007 | 7 | 4.5 | 4.7 | 4.5 |
| 2006 | 8 | 3.4 | 7.9 | 4.6 |
| 2005 | 9 | 2.0 | 10.1 | 4.2 |
| 2004 | 10 | 5.7 | 14.7 | 8.2 |
SOURCE: Bureau of Transportation Statistics
Table 6: Passenger Transportation Services Index Monthly Changes, 2011-2014
Percent change from previous month
| 2011 % Change | 2012 % Change | 2013 % Change | 2014 % Change | |
|---|---|---|---|---|
| January | 0.2 | -1.2 | 0.2 | 0.0 |
| February | -1.4 | 1.4 | -0.2 | 0.1 |
| March | 1.8 | -0.1 | -0.1 | |
| April | 0.1 | -0.3 | 1.2 | |
| May | 1.1 | -0.4 | 0.0 | |
| June | -0.7 | 0.0 | 0.1 | |
| July | 1.0 | -0.6 | -0.6 | |
| August | -2.4 | 1.0 | 0.7 | |
| September | 2.4 | -0.2 | -0.3 | |
| October | -0.1 | -1.4 | 1.0 | |
| November | -0.1 | 0.4 | 0.0 | |
| December | 0.7 | 1.3 | -0.2 |
SOURCE: Bureau of Transportation Statistics
Table 7: Passenger Transportation Services Index from Year-to-Year
Percent change in the February Passenger TSI
(Monthly average of 2000 = 100)
| February Passenger TSI | Percent change from same month previous year | |
|---|---|---|
| 2005 | 107.7 | 4.2 |
| 2006 | 110.0 | 2.1 |
| 2007 | 113.3 | 3.0 |
| 2008 | 118.0 | 4.1 |
| 2009 | 110.0 | -6.8 |
| 2010 | 108.2 | -1.6 |
| 2011 | 111.9 | 3.5 |
| 2012 | 116.6 | 4.2 |
| 2013 | 116.3 | -0.2 |
| 2014 | 118.6 | 2.0 |
SOURCE: Bureau of Transportation Statistics
NOTE: Percent changes based on numbers prior to rounding.
Table 8: Combined Transportation Services Index Monthly Changes, 2011-2014
Percent change from previous month
| 2011 % Change | 2012 % Change | 2013 % Change | 2014 % Change | |
|---|---|---|---|---|
| January | 0.7 | -2.7 | 0.4 | -1.8 |
| February | -1.4 | 0.7 | 0.5 | 0.8 |
| March | 1.6 | -0.4 | 0.5 | |
| April | -0.2 | 0.4 | -0.3 | |
| May | -1.4 | 0.1 | 0.7 | |
| June | 1.2 | 0.2 | 0.0 | |
| July | 0.6 | -0.4 | 0.0 | |
| August | -0.3 | 0.1 | 0.5 | |
| September | 1.1 | -0.1 | 0.1 | |
| October | 0.1 | -1.9 | 0.2 | |
| November | 0.0 | 1.2 | 1.8 | |
| December | 2.7 | 1.2 | -0.5 |
SOURCE: Bureau of Transportation Statistics
Table 9: Combined Transportation Services Index from Year-to-Year
Percent change in the February Combined TSI
(Monthly average of 2000 = 100)
| February Combined TSI | Percent change from same month previous year | |
|---|---|---|
| 2005 | 111.7 | 3.8 |
| 2006 | 111.3 | -0.3 |
| 2007 | 111.4 | 0.1 |
| 2008 | 113.6 | 2.0 |
| 2009 | 103.4 | -8.9 |
| 2010 | 105.3 | 1.8 |
| 2011 | 109.0 | 3.6 |
| 2012 | 112.6 | 3.3 |
| 2013 | 114.0 | 1.2 |
| 2014 | 116.3 | 2.1 |
SOURCE: Bureau of Transportation Statistics
NOTE: Percent changes based on numbers prior to rounding.