
Freight Shipments Rose 1.2% in January from December
Five Years: Freight Transportation Services Index, February 2008-January 2013
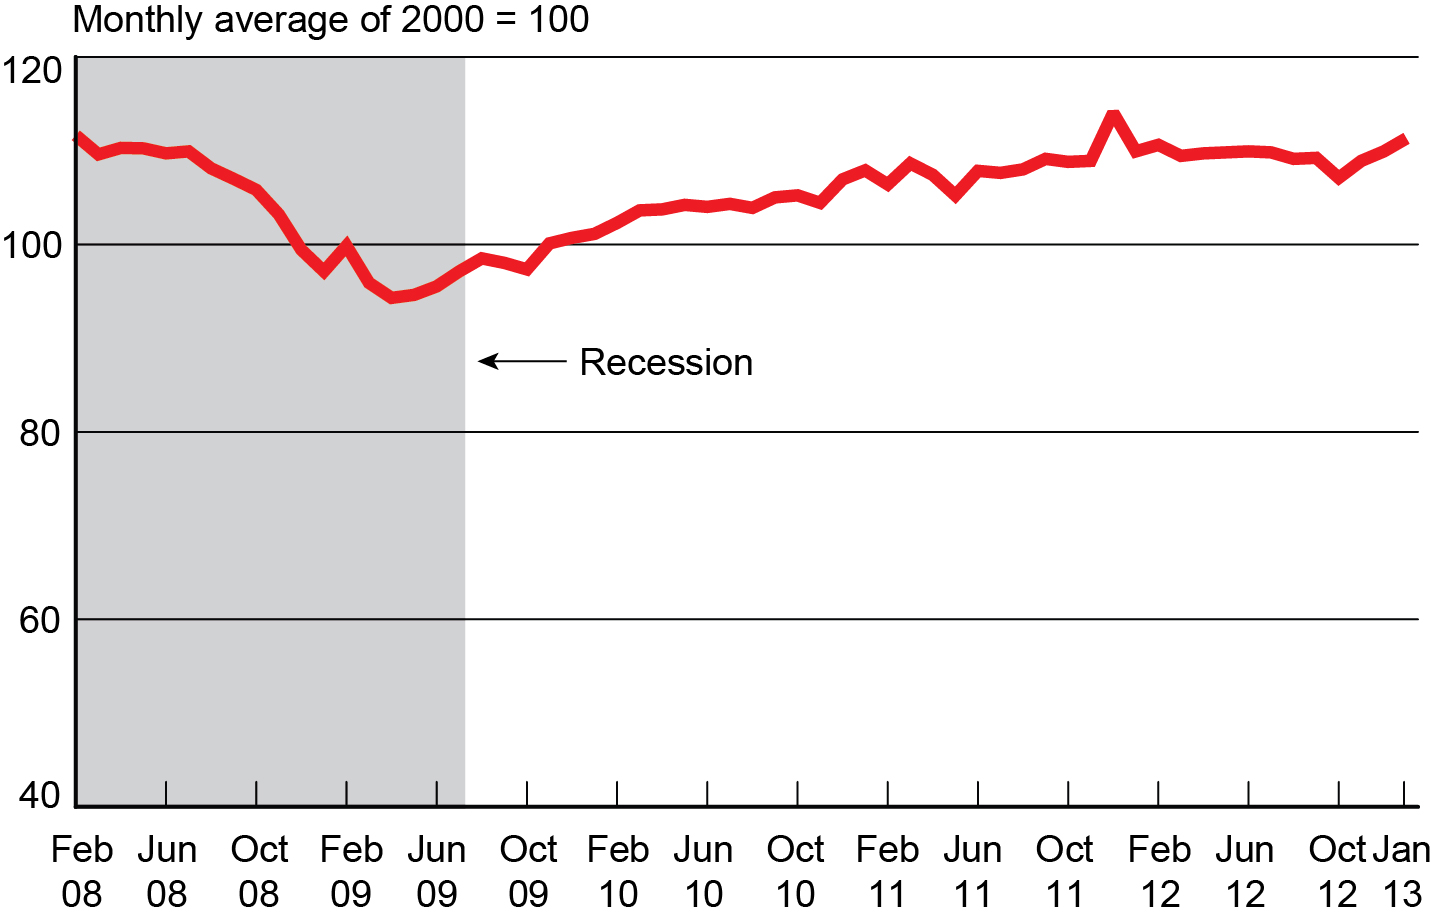
Source for Recession Dates: National Bureau of Economic Research, US Business Cycle Expansions and Contractions
The amount of freight carried by the for-hire transportation industry rose 1.2 percent in January from December, rising for the third consecutive month, according to the U.S. Department of Transportation’s Bureau of Transportation Statistics’ (BTS) Freight Transportation Services Index (TSI) released today. The January 2013 index level (111.3) was 18.0 percent above the April 2009 low during the recession and the highest level since December 2011 (Tables 1, 2A).
BTS, a part of the Department’s Research and Innovative Technology Administration, reported that the level of freight shipments in January measured by the Freight TSI (111.3) was 2.4 percent below the all-time high level of 114.0 in December 2011 (Table 2A). BTS’ TSI records began in 1990. See historical TSI data.
The Freight TSI measures the month-to-month changes in freight shipments by mode of transportation in tons and ton-miles, which are combined into one index. The index measures the output of the for-hire freight transportation industry and consists of data from for-hire trucking, rail, inland waterways, pipelines and air freight.
Analysis: The Freight TSI increased in January 2013, its third consecutive month of growth with trucking showing a large increase. The TSI increase in January likely resulted from inventory growth. Wholesale inventories grew 1.2 percent during the month, according to the U.S. Census Bureau’s Monthly Wholesale Trade report. The restocking followed the drawdown of inventories in the fourth quarter of 2012.
Trend: With the January increase to 111.3, the index rose above the narrow band in which it remained through most of 2012. The exception was a drop in October (107.1) as a result of Hurricane Sandy. The index began 2013 in January at 111.3, the second highest level since April 2009. After dipping to 94.3 in April 2009 during the recession, freight shipments increased in 30 of the last 45 months, rising 18.0 percent during that period (Tables 2, 2A). For additional historical data, go to TSI data.
Index highs and lows: Freight shipments in January 2013 (111.3) were 18.0 percent higher than the recent low in April 2009 during the recession (94.3). In April 2009, freight shipments were at their lowest level since June 1997 (92.3). The January 2013 level is down 2.4 percent from the historic peak reached in December 2011 (114.0).
Year-to-date: Freight shipments measured by the index were up 1.2 percent in January compared to the end of 2012. In comparison, the index declined 3.6 percent during the same period a year earlier in 2012 (Table 3).
Long-term trend: Freight shipments are down 0.5 percent in the five years from its level at the beginning of the recession in January 2008 and are up 7.8 percent in the 10 years from January 2003 despite declines in recent years (Table 5).
Same month of previous year: January 2013 freight shipments were up 1.3 percent from January 2012, but rose 14.6 percent from January 2009 during the recession. Shipments measured by the index remained below the level of January 2005 (113.3) prior to the recession (Tables 4, 5).
The TSI has three seasonally adjusted indexes that measures changes from the monthly average of the base year of 2000. The three indexes are freight shipments, passenger travel and a combined measure that merges the freight and passenger indexes. TSI includes historical data from 1990 to the present. Release of the February index is scheduled for April 10.
Passenger Index: The TSI for passengers fell 1.0 percent in January from its December level (Table 6). The Passenger TSI January 2013 level of 117.3 was 1.8 percent above the January 2012 level (Table 7). The index is up 0.3 percent in five years and up 21.1 percent in 10 years (Table 5). The passenger TSI measures the month-to-month changes in travel that involves the services of the for-hire passenger transportation sector. The seasonally adjusted index consists of data from air, local transit and intercity rail.
Combined Index: The combined freight and passenger TSI rose 0.6 percent in January from its December level (Table 8). The combined TSI January 2013 level of 112.9 was 1.4 percent above the January 2012 level (Table 9). The combined index is down 0.3 percent in five years and up 11.4 percent in 10 years despite recent declines (Table 5). The combined TSI merges the freight and passenger indexes into a single index.
Revisions: TSI numbers for September (Freight, Passenger and Combined) were revised because of revisions in the output data of the component transportation services. The September Freight TSI is 109.2, unchanged from 109.2 reported in last month’s release. The September Passenger TSI is 116.0 revised from 118.5. The September Combined TSI is 111.0 revised from 111.7. The TSI for October, November, December and January are preliminary.
TSI revision policy: TSI is updated monthly with the latest four months’ index numbers considered preliminary. Each month BTS releases the latest preliminary TSI, and replaces the oldest preliminary TSI with a revised TSI. More information about the BTS revision policies is available at monthly revision policy and 2011 Comprehensive Revision.
Table 1: Freight, Passenger and Combined Transportation Services Indexes Since July 2012
Percent Change from Previous Month
(Seasonally Adjusted, Monthly Average of 2000 = 100)
| Freight | Passenger | Combined | ||||
|---|---|---|---|---|---|---|
| Index | Pct. Change | Index | Pct. Change | Index | Pct. Change | |
| July | 109.8 | -0.1 | 114.8 | -0.9 | 111.1 | -0.3 |
| August | 109.1 | -0.7 | 116.2 | 1.2 | 110.9 | -0.1 |
| SeptemberR | 109.2 | 0.1 | 116.0 | -0.2 | 111.0 | 0.0 |
| OctoberP | 107.1 | -1.9 | 117.5 | 1.3 | 109.9 | -1.0 |
| NovemberP | 108.9 | 1.7 | 117.6 | 0.1 | 111.2 | 1.2 |
| DecemberP | 109.9 | 1.0 | 118.4 | 0.7 | 112.2 | 0.9 |
| JanuaryP | 111.3 | 1.2 | 117.3 | -1.0 | 112.9 | 0.6 |
SOURCE: Bureau of Transportation Statistics
NOTE: P = preliminary; R = revised
NOTE: Percent changes based on numbers prior to rounding.
Table 2: Freight Transportation Services Index Monthly Changes, 2010-2013
Percent change from previous month
| 2010 % Change | 2011 % Change | 2012 % Change | 2013 % Change | |
|---|---|---|---|---|
| January | 0.5 | 1.0 | -3.6 | (P) 1.2 |
| February | 1.1 | -1.4 | 0.7 | |
| March | 1.2 | 2.0 | -1.0 | |
| April | 0.1 | -1.0 | 0.1 | |
| May | 0.5 | -2.1 | 0.1 | |
| June | -0.1 | 2.5 | 0.1 | |
| July | 0.3 | -0.2 | -0.1 | |
| August | -0.4 | 0.4 | -0.7 | |
| September | 1.1 | 1.1 | (R) 0.1 | |
| October | 0.2 | -0.3 | (P) -1.9 | |
| November | -0.7 | 0.1 | (P) 1.7 | |
| December | 2.4 | 4.7 | (P) 1.0 |
SOURCE: Bureau of Transportation Statistics
NOTE: P = preliminary; R = revised
Table 2A: Freight Transportation Services Index by Month, 2010-2013
| 2010 | 2011 | 2012 | 2013 | |
|---|---|---|---|---|
| January | 101.1 | 107.9 | 109.9 | (P) 111.3 |
| February | 102.3 | 106.4 | 110.6 | |
| March | 103.6 | 108.6 | 109.5 | |
| April | 103.7 | 107.4 | 109.7 | |
| May | 104.2 | 105.2 | 109.8 | |
| June | 104.0 | 107.8 | 109.9 | |
| July | 104.3 | 107.6 | 109.8 | |
| August | 103.9 | 108.0 | 109.1 | |
| September | 105.0 | 109.1 | (R) 109.2 | |
| October | 105.2 | 108.8 | (P) 107.1 | |
| November | 104.4 | 108.9 | (P) 108.9 | |
| December | 106.9 | 114.0 | (P) 109.9 |
SOURCE: Bureau of Transportation Statistics
NOTE: P = preliminary; R = revised
Table 3: Year-to-Date Change in Freight, Passenger and Combined Transportation Services Indexes, 2004-2013
Percent change to January from December of the previous year
| Year | Freight | Passenger | Combined |
|---|---|---|---|
| 2004 | -0.1 | -0.8 | -0.3 |
| 2005 | 2.8 | 1.2 | 2.3 |
| 2006 | 0.0 | 1.3 | 0.4 |
| 2007 | -1.3 | 0.0 | -0.9 |
| 2008 | 1.8 | -0.2 | 1.2 |
| 2009 | -2.4 | -1.0 | -2.0 |
| 2010 | 0.5 | 0.6 | 0.5 |
| 2011 | 1.0 | 0.2 | 0.7 |
| 2012 | -3.6 | -1.0 | -2.9 |
| 2013P | 1.2 | -1.0 | 0.6 |
SOURCE: Bureau of Transportation Statistics
NOTE: P = preliminary
Table 4: Freight Transportation Services Index from Year-to-Year
Percent change in the January Freight TSI
(Monthly average of 2000 = 100)
| January Freight TSI | Percent change from same month previous year | |
|---|---|---|
| 2004 | 107.3 | 4.0 |
| 2005 | 113.3 | 5.6 |
| 2006 | 111.5 | -1.6 |
| 2007 | 108.4 | -2.8 |
| 2008 | 111.8 | 3.2 |
| 2009 | 97.1 | -13.2 |
| 2010 | 101.1 | 4.2 |
| 2011 | 107.9 | 6.7 |
| 2012 | 109.9 | 1.8 |
| 2013P | 111.3 | 1.3 |
SOURCE: Bureau of Transportation Statistics
NOTE: P = preliminary
NOTE: Percent changes based on numbers prior to rounding.
Table 5: Transportation Services Indexes from Previous Years
Percent Change to January 2013 from January of previous years
| Since January . . . | Duration in years | Freight TSI Percent change to January 2013 | Passenger TSI Percent change to January 2013 | Combined TSI Percent change to January 2013 |
|---|---|---|---|---|
| 2012 | 1 | 1.3 | 1.8 | 1.4 |
| 2011 | 2 | 3.1 | 3.3 | 3.2 |
| 2010 | 3 | 10.0 | 6.0 | 8.9 |
| 2009 | 4 | 14.6 | 6.9 | 12.5 |
| 2008 | 5 | -0.5 | 0.3 | -0.3 |
| 2007 | 6 | 2.6 | 2.7 | 2.7 |
| 2006 | 7 | -0.2 | 6.1 | 1.6 |
| 2005 | 8 | -1.8 | 8.9 | 1.1 |
| 2004 | 9 | 3.6 | 17.8 | 7.5 |
| 2003 | 10 | 7.8 | 21.1 | 11.4 |
SOURCE: Bureau of Transportation Statistics
Note: The percent changes to January 2013 are all preliminary.
Table 6: Passenger Transportation Services Index Monthly Changes, 2010-2013
Percent change from previous month
| 2010 % Change | 2011 % Change | 2012 % Change | 2013 % Change | |
|---|---|---|---|---|
| January | 0.6 | 0.2 | -1.0 | (P) -1.0 |
| February | -2.1 | -0.2 | 1.4 | |
| March | 2.3 | 0.9 | -0.3 | |
| April | 0.2 | -0.1 | -0.4 | |
| May | 0.6 | 1.2 | -0.2 | |
| June | 0.8 | -0.6 | 0.1 | |
| July | -0.2 | 0.1 | -0.9 | |
| August | 0.2 | -1.2 | 1.2 | |
| September | 1.0 | 1.4 | (R) -0.2 | |
| October | 0.9 | -0.4 | (P) 1.3 | |
| November | -0.3 | 0.5 | (P) 0.1 | |
| December | -1.0 | 0.9 | (P) 0.7 |
SOURCE: Bureau of Transportation Statistics
NOTE: P = preliminary; R = revised
Table 7: Passenger Transportation Services Index from Year-to-Year
Percent change in the January Passenger TSI
(Monthly average of 2000 = 100)
| January Passenger TSI | Percent change from same month previous year | |
|---|---|---|
| 2004 | 99.6 | 2.9 |
| 2005 | 107.7 | 8.2 |
| 2006 | 110.5 | 2.6 |
| 2007 | 114.2 | 3.4 |
| 2008 | 116.9 | 2.3 |
| 2009 | 109.7 | -6.2 |
| 2010 | 110.6 | 0.9 |
| 2011 | 113.5 | 2.6 |
| 2012 | 115.2 | 1.5 |
| 2013P | 117.3 | 1.8 |
SOURCE: Bureau of Transportation Statistics
NOTE: P = preliminary
NOTE: Percent changes based on numbers prior to rounding.
Table 8: Combined Transportation Services Index Monthly Changes, 2010-2013
Percent change from previous month
| 2010 % Change | 2011 % Change | 2012 % Change | 2013 % Change | |
|---|---|---|---|---|
| January | 0.5 | 0.7 | -2.9 | (P) 0.6 |
| February | 0.2 | -1.1 | 0.9 | |
| March | 1.5 | 1.7 | -0.8 | |
| April | 0.1 | -0.8 | 0.0 | |
| May | 0.5 | -1.2 | 0.0 | |
| June | 0.1 | 1.6 | 0.1 | |
| July | 0.1 | -0.1 | -0.3 | |
| August | -0.2 | -0.1 | -0.1 | |
| September | 1.0 | 1.2 | (R) 0.0 | |
| October | 0.4 | -0.3 | (P) -1.0 | |
| November | -0.6 | 0.2 | (P) 1.2 | |
| December | 1.5 | 3.6 | (P) 0.9 |
SOURCE: Bureau of Transportation Statistics
NOTE: P = preliminary; R = revised
Table 9: Combined Transportation Services Index from Year-to-Year
Percent change in the January Combined TSI
(Monthly average of 2000 = 100)
| January Combined TSI | Percent change from same month previous year | |
|---|---|---|
| 2004 | 105.0 | 3.7 |
| 2005 | 111.6 | 6.3 |
| 2006 | 111.1 | -0.4 |
| 2007 | 109.9 | -1.1 |
| 2008 | 113.2 | 3.0 |
| 2009 | 100.4 | -11.3 |
| 2010 | 103.6 | 3.3 |
| 2011 | 109.4 | 5.6 |
| 2012 | 111.3 | 1.7 |
| 2013P | 112.9 | 1.4 |
SOURCE: Bureau of Transportation Statistics
NOTE: P = preliminary
NOTE: Percent changes based on numbers prior to rounding.