
Freight Transportation Services Index, February 2022 - February 2026
Figure
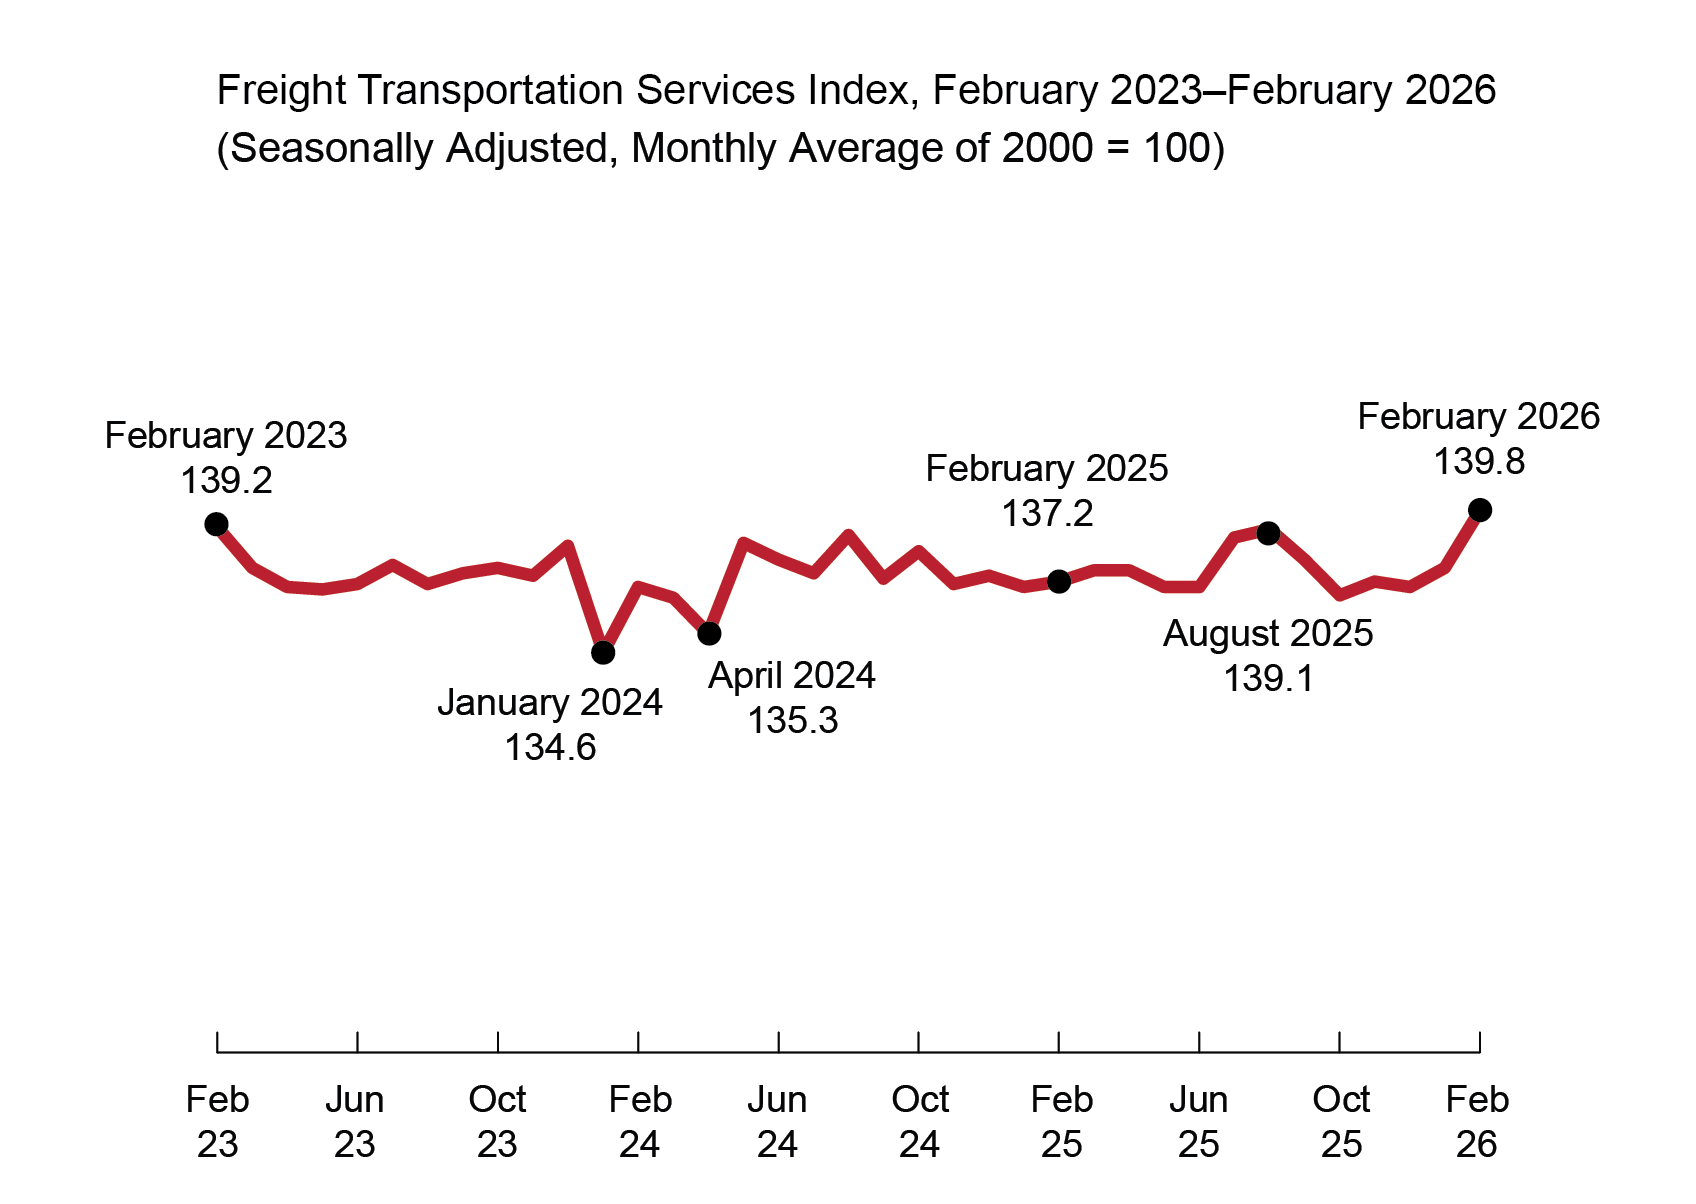
Dataset Table:
| Month | Freight TSI |
|---|---|
| Feb-23 | 139.2 |
| Mar-23 | 137.7 |
| Apr-23 | 137.0 |
| May-23 | 136.9 |
| Jun-23 | 137.1 |
| Jul-23 | 137.8 |
| Aug-23 | 137.1 |
| Sept-23 | 137.5 |
| Oct-23 | 137.7 |
| Nov-23 | 137.4 |
| Dec-23 | 138.5 |
| Jan-24 | 134.6 |
| Feb-24 | 137.0 |
| Mar-24 | 136.6 |
| Apr-24 | 135.3 |
| May-24 | 138.6 |
| Jun-24 | 138.0 |
| Jul-24 | 137.5 |
| Aug-24 | 138.9 |
| Sep-24 | 137.3 |
| Oct-24 | 138.3 |
| Nov-24 | 137.1 |
| Dec-24 | 137.4 |
| Jan-25 | 137.0 |
| Feb-25 | 137.2 |
| Mar-25 | 137.6 |
| Apr-25 | 137.6 |
| May-25 | 137.0 |
| Jun-25 | 137.0 |
| Jul-25 | 138.8 |
| Aug-25 | 139.1 |
| Sep-25 | 138.0 |
| Oct-25 | 136.7 |
| Nov-25 | 137.2 |
| Dec-25 | 137.0 |
| Jan-26 | 137.7 |
| Feb-26 | 139.8 |