
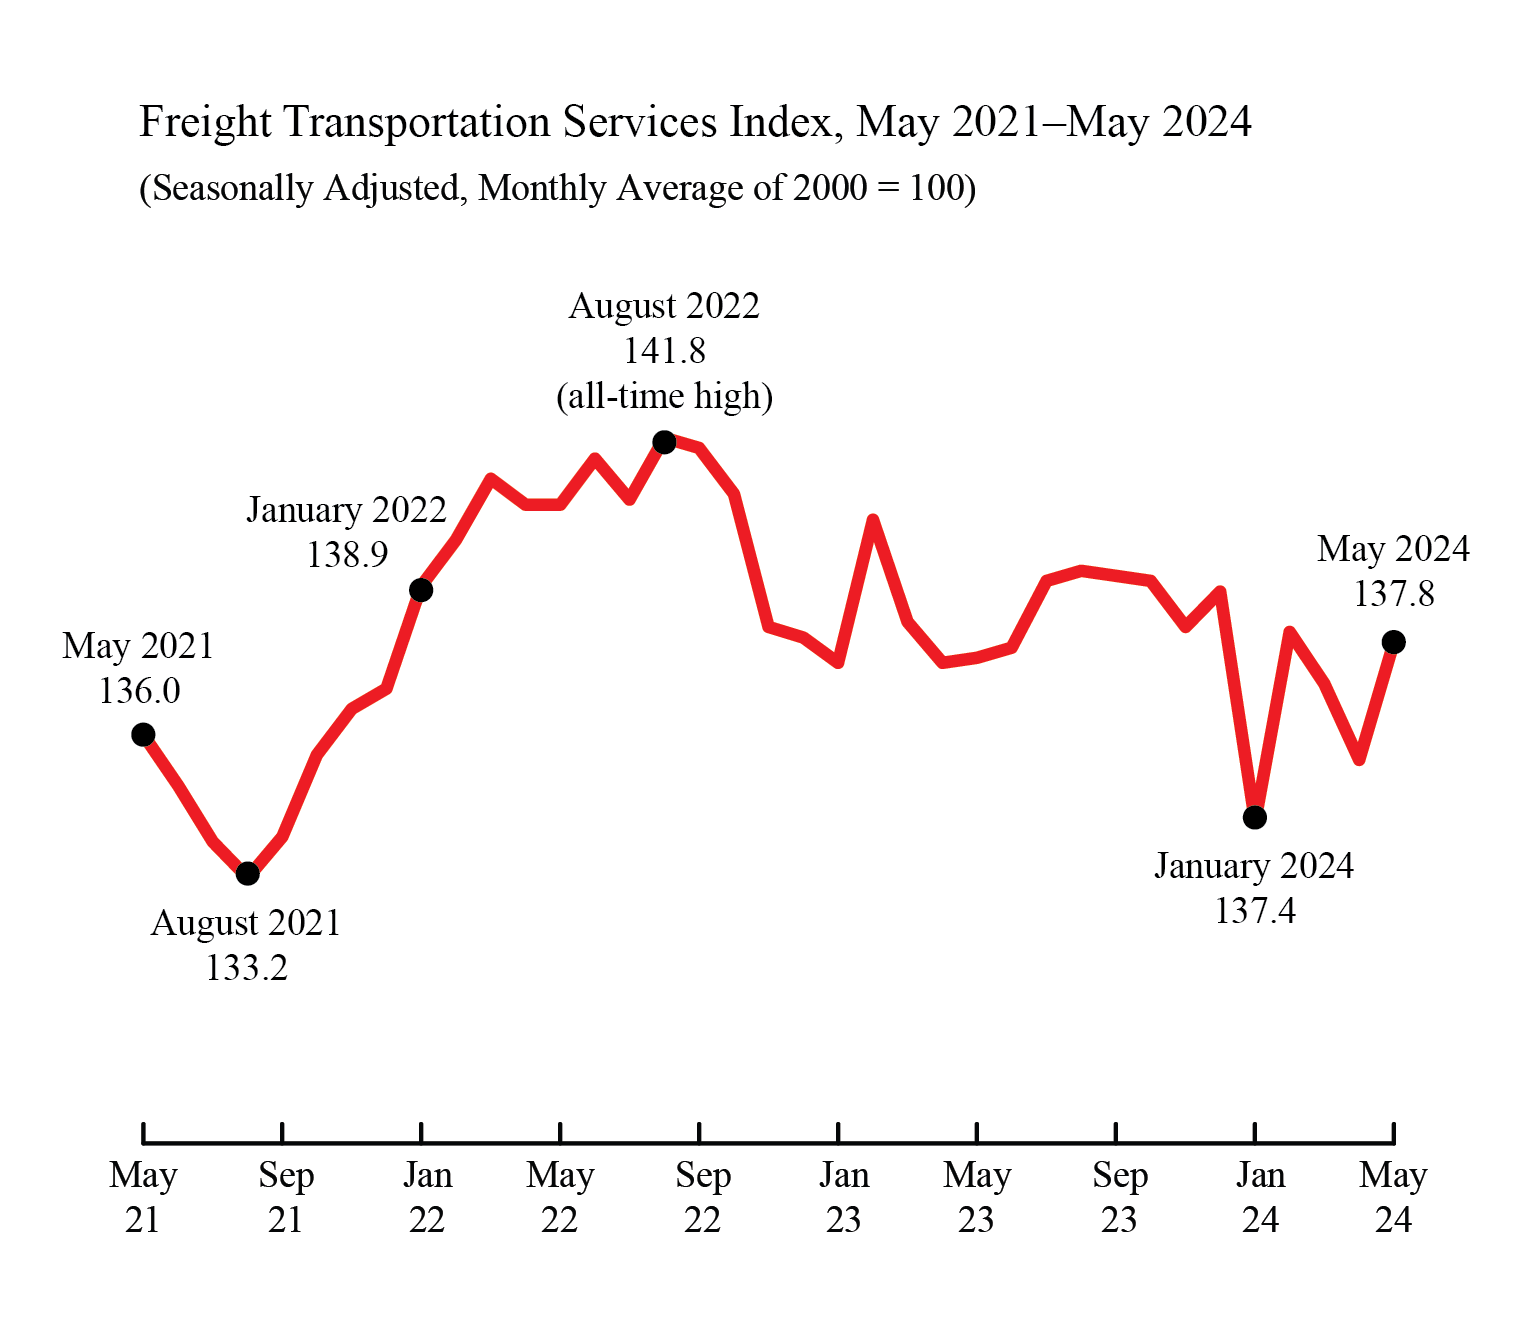
Freight Transportation Services Index, May 2021 - May 2024
(Seasonally Adjusted, Monthly Average of 2000 = 100)
Figure
Dataset Table:
| Month | Freight TSI |
|---|---|
| May-21 | 136.0 |
| Jun-21 | 135.0 |
| Jul-21 | 133.9 |
| Aug-21 | 133.2 |
| Sep-21 | 134.0 |
| Oct-21 | 135.6 |
| Nov-21 | 136.5 |
| Dec-21 | 136.9 |
| Jan-22 | 138.9 |
| Feb-22 | 139.8 |
| Mar-22 | 141.0 |
| Apr-22 | 140.5 |
| May-22 | 140.5 |
| Jun-22 | 141.4 |
| Jul-22 | 140.6 |
| Aug-22 | 141.8 |
| Sep-22 | 141.6 |
| Oct-22 | 140.7 |
| Nov-22 | 138.1 |
| Dec-22 | 137.9 |
| Jan-23 | 137.4 |
| Feb-23 | 140.2 |
| Mar-23 | 138.2 |
| Apr-23 | 137.4 |
| May-23 | 137.5 |
| Jun-23 | 137.7 |
| Jul-23 | 139.0 |
| Aug-23 | 139.2 |
| Sep-23 | 139.1 |
| Oct-23 | 139.0 |
| Nov-23 | 138.1 |
| Dec-23 | 138.8 |
| Jan-24 | 134.3 |
| Feb-24 | 138.0 |
| Mar-24 | 137.0 |
| Apr-24 | 135.5 |
| May-24 | 137.8 |
Source:
Bureau of Transportation Statistics