
Full Year 2020 and December 2020 U.S. Airline Traffic Data
Release Number: BTS 18-21
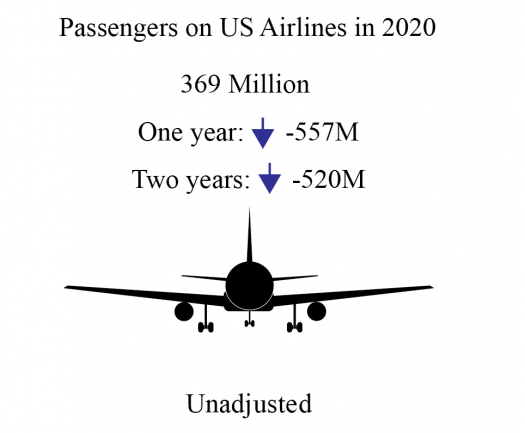
U.S. airlines carried 557 million fewer passengers in 2020 than in 2019, down 60% year-to-year. For the full year 2020, January through December, U.S. airlines carried 369 million passengers (unadjusted) down from 927 million in 2019 and 889 million in 2018. Passenger traffic in 2020 was the lowest on U.S. airlines since the mid-1980s.
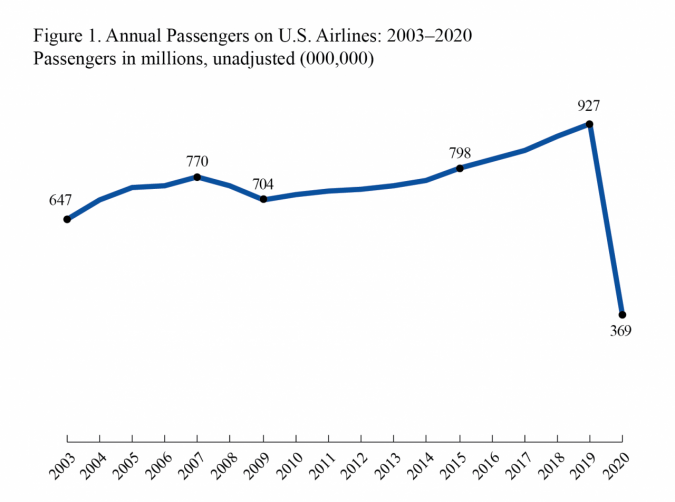
Figure 1. January-December Passengers on U.S. Airlines - 2003-2020
| U.S. Airline Jan-Dec Passengers | |||||||||||||||
|---|---|---|---|---|---|---|---|---|---|---|---|---|---|---|---|
| 2003 | 647 | ||||||||||||||
| 2004 | 704 | ||||||||||||||
| 2005 | 739 | ||||||||||||||
| 2006 | 745 | ||||||||||||||
| 2007 | 770 | ||||||||||||||
| 2008 | 743 | ||||||||||||||
| 2009 | 704 | ||||||||||||||
| 2010 | 720 | ||||||||||||||
| 2011 | 731 | ||||||||||||||
| 2012 | 737 | ||||||||||||||
| 2013 | 743 | ||||||||||||||
| 2014 | 763 | ||||||||||||||
| 2015 | 798 | ||||||||||||||
| 2016 | 824 | ||||||||||||||
| 2017 | 849 | ||||||||||||||
| 2018 | 889 | ||||||||||||||
| 2019 | 927 | ||||||||||||||
| 2020 | 369 |
Annual unadjusted
- Systemwide enplanements (369 million) were down 60% from the all-time annual high (927M) reached in 2019.
- Domestic enplanements (335M) were down 59% from the all-time annual high (811M) reached in 2019.
- International enplanements (34M) were down 70% from the all-time annual high (115M) reached in 2019.
Month of December
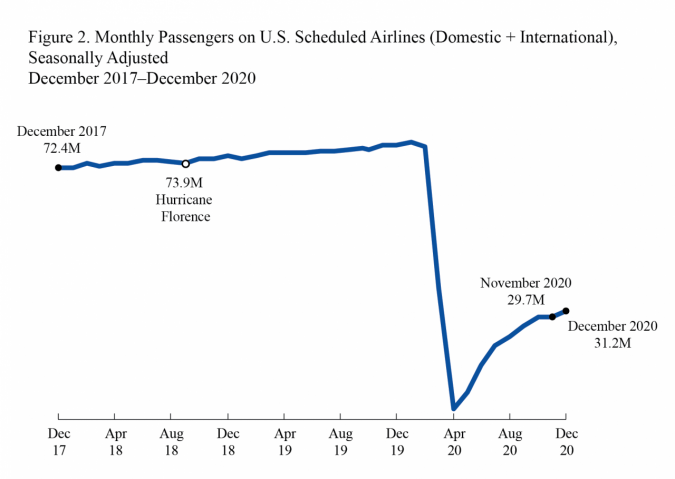
U.S. airlines carried 31.2 million systemwide (domestic and international) scheduled service passengers in December 2020 (seasonally-adjusted) according to the Bureau of Transportation Statistics’ (BTS), up 5.0% from November. The 31.2 million passengers in December were the most on U.S. airlines since 37.7 million passengers in March.
BTS reported 27.9 million domestic passengers and 3.3 million international passengers on U.S. airlines’ flights in December.
U.S. airline traffic reports are filed monthly with BTS. See the tables that accompany this release on the BTS website for summary data since 2016 (Tables 1-24) and complete data since 2000.
Two measures of U.S. airlines passenger enplanements
December seasonally-adjusted
- System-wide enplanements (31.2M) were down 60.9% from the all-time high of 79.7M reached in January 2020.
- Domestic enplanements (27.9M) were down 60.1% from the all-time high of 69.9M reached in January 2020.
- International enplanements (3.32M) were down 66% from the all-time high of 9.77M reached in January 2020.
December unadjusted
- Systemwide enplanements (30.5M) were down 61.5% from the all-time December high (79.3M) reached in 2019 and up 6.2% from November 2020 (28.7M).
- Domestic enplanements (27.3M) were down 60.9% from the all-time December high (69.7M) reached in 2019 and up 3.7% from November 2020 (26.3M).
- International enplanements (3.26M) were down 66.0% from the all-time December high (9.6M) reached in 2019 and up 33.0% from November 2020 (2.45M).
Table A. Seasonally Adjusted Passenger Enplanements Compared to Previous Time Periods
|
Seasonally Adjusted |
Passengers (in millions) |
Percent Change Compared to |
||
|
Previous Month |
Previous Year |
Three Years Previous |
||
|
December |
31.2 |
5.0% |
-60.4% |
-56.9% |
Table B. Unadjusted Passenger Enplanements Compared to Previous Time Periods
|
Unadjusted |
Passengers (in millions) |
Percent Change Compared to |
||
|
Previous Year |
Two Years Previous |
Three Years Previous |
||
|
December |
30.5 |
-61.5% |
-58.1% |
-56.6% |
For data filed through December, see accompanying tables. For the complete database of reported data, see Traffic. For an explanation of BTS’ seasonal adjustment methodology, see Seasonal Adjustment.
Reporting Notes
Data are compiled from monthly reports filed with BTS by commercial U.S. air carriers detailing operations, passenger traffic and freight traffic. This release includes data received by BTS from 67 U.S. carriers as of March 2 for U.S. carrier scheduled civilian operations.
See the BTS Airlines and Airports page for additional scheduled service numbers through December for U.S. airlines. International data by origin and destination is available through September.
BTS has scheduled April 15 for the release of data through January.
None of the data are from samples. Measures of statistical significance do not apply to the complete air traffic data.