
July 2015 Freight Transportation Services Index (TSI)
The Freight Transportation Services Index (TSI), which is based on the amount of freight carried by the for-hire transportation industry, rose 0.6 percent in July from June, rising after a single month of decline, according to the U.S. Department of Transportation’s Bureau of Transportation Statistics’ (BTS). The July 2015 index level (122.8) was 29.7 percent above the April 2009 low during the most recent recession (Tables 1, 2, and 2A).
Freight Transportation Services Index, July 2010 - July 2015
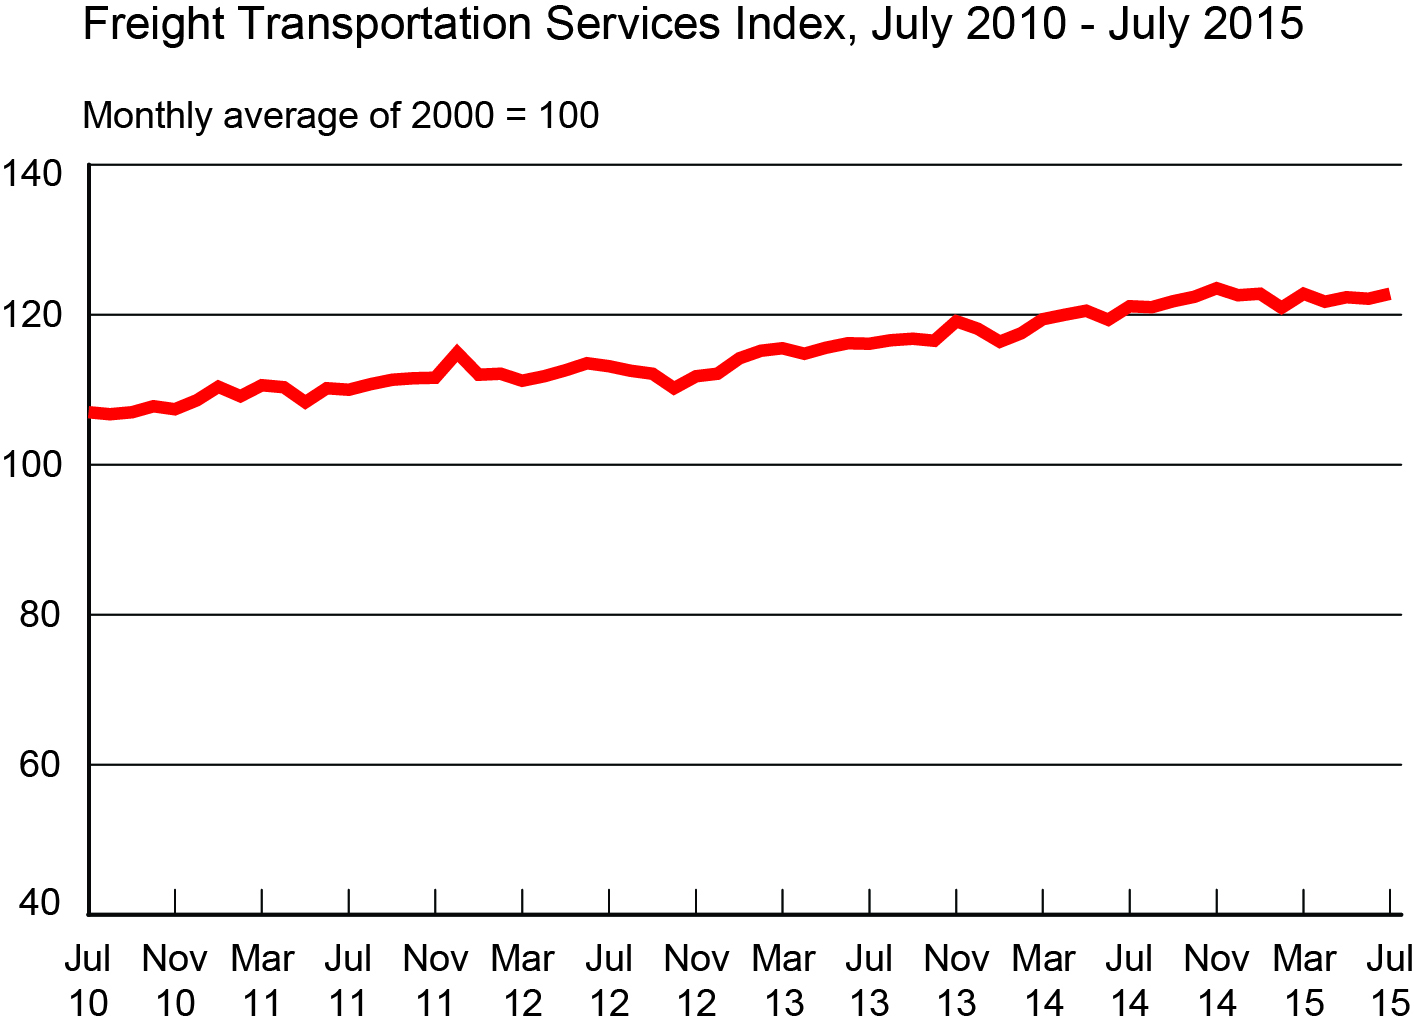
The level of freight shipments in July measured by the Freight TSI (122.8) was 0.5 percent below the all-time high level of 123.5 in November 2014 (Table 2A). BTS’ TSI records begin in 2000. See historical TSI data.
The June index was revised to 122.1 from 121.9 in last month’s release. The March, April, and May indexes were also revised up slightly.
The Freight TSI measures the month-to-month changes in freight shipments by mode of transportation in tons and ton-miles, which are combined into one index. The index measures the output of the for-hire freight transportation industry and consists of data from for-hire trucking, rail, inland waterways, pipelines and air freight.
Trend: The July increase of 0.6 percent in the Freight TSI continued the trend that began after the index peaked in November 2014. The index has alternated months of increases and decreases with the monthly indexes ranging from 0.5 percent below the November level to 2.1 percent lower. Following the increase in July, the index was 0.5 percent lower than the all-time high, returning to its March 2015 level after three months below that level. After dipping to 94.7 in April 2009, the index rose 29.7 percent in the succeeding 75 months. For additional historical data, go to TSI data.
Analysis: The Freight TSI increase was part of broad economic growth in July that was reflected in several measures that impact transportation. The Federal Reserve Board Industrial Production index rose 0.6 percent, the same percentage increase as the Freight TSI. Personal income, employment and housing starts all rose. Among the transportation modes, significant increases in trucking and rail carloads led the TSI Freight index upward along with a smaller increase in air freight. Water, pipeline and rail intermodal declined.
Index highs and lows: Freight shipments in July 2015 (122.8) were 29.7 percent higher than the recent low in April 2009 during the recession (94.7). The July 2015 level was 0.5 percent below the historic peak reached in November 2014 (123.5).
Year to date: Freight shipments measured by the index were up 0.2 percent in July compared to the end of 2014 (Table 3).
Long-term trend: Freight shipments are up 14.8 percent in the five years from the post-recession level of July 2010 and are up 9.8 percent in the 10 years from July 2005 (Table 5).
Same month of previous year: July 2015 freight shipments were up 1.4 percent from July 2014 (Tables 4, 5).
The TSI has three seasonally adjusted indexes that measure changes from the monthly average of the base year of 2000. The three indexes are freight shipments, passenger travel and a combined measure that merges the freight and passenger indexes. See Seasonally-Adjusted Transportation Data for numbers for individual modes. TSI includes data from 2000 to the present. Release of the August index is scheduled for Oct. 15.
Passenger Index: The TSI for passengers rose 0.1 percent in July from its June level (Table 6). The Passenger TSI July 2015 level of 122.2 was 1.8 percent above the July 2014 level (Table 7). The index is up 9.0 percent in five years and up 12.0 percent in 10 years (Table 5). The passenger TSI measures the month-to-month changes in travel that involves the services of the for-hire passenger transportation sector. The seasonally-adjusted index consists of data from air, local transit and intercity rail.
Combined Index: The combined freight and passenger TSI rose 0.4 percent in July from its June level (Table 8). The combined TSI July 2015 level of 122.7 was 1.5 percent above the July 2014 level (Table 9). The combined index is up 13.0 percent in five years and up 10.3 percent in 10 years (Table 5). The combined TSI merges the freight and passenger indexes into a single index.
Revisions: Monthly data has changed from previous releases due to the use of concurrent seasonal analysis, which results in seasonal analysis factors changing as each month’s data are added.
BTS research has shown a clear relationship between economic cycles and the Freight and Passenger Transportation Services Indexes. See a study of this relationship using smoothed and detrended TSI data. Researchers who wish to compare TSI over time with other economic indicators, can use the FRED database, which includes freight, passenger and combined TSI, and which makes it possible to easily graph TSI alongside the other series in that database. See TSI data on FRED.
For a video explanation of the TSI, see Overview of the Transportation Services Index. A BTS report explaining the TSI, Transportation Services Index and the Economy, is available for download.
Table 1: Freight, Passenger and Combined Transportation Services Indexes Since January 2015
Percent Change from Previous Month
(Seasonally Adjusted, Monthly Average of 2000 = 100)
| Freight | Passenger | Combined | ||||
|---|---|---|---|---|---|---|
| Index | Pct. Change | Index | Pct. Change | Index | Pct. Change | |
| January | 122.8 | 0.2 | 119.4 | -1.4 | 121.9 | -0.3 |
| February | 120.9 | -1.6 | 118.4 | -0.9 | 120.2 | -1.4 |
| March | 122.8 | 1.6 | 120.6 | 1.9 | 122.2 | 1.7 |
| April | 121.7 | -0.9 | 121.2 | 0.5 | 121.6 | -0.5 |
| May | 122.3 | 0.5 | 121.3 | 0.1 | 122.1 | 0.4 |
| June | 122.1 | -0.1 | 122.0 | 0.5 | 122.2 | 0.1 |
| July | 122.8 | 0.6 | 122.2 | 0.1 | 122.7 | 0.4 |
SOURCE: Bureau of Transportation Statistics
NOTE: Percent changes based on numbers prior to rounding.
Table 2: Freight Transportation Services Index Monthly Changes, 2012-2015
Percent change from previous month
| 2012 % Change | 2013 % Change | 2014 % Change | 2015 % Change | |
|---|---|---|---|---|
| January | -2.6 | 1.9 | -1.5 | 0.2 |
| February | 0.1 | 0.8 | 1.0 | -1.6 |
| March | -0.8 | 0.3 | 1.6 | 1.6 |
| April | 0.5 | -0.6 | 0.5 | -0.9 |
| May | 0.7 | 0.8 | 0.4 | 0.5 |
| June | 0.8 | 0.5 | -0.9 | -0.1 |
| July | -0.3 | -0.1 | 1.5 | 0.6 |
| August | -0.6 | 0.4 | -0.1 | |
| September | -0.3 | 0.1 | 0.6 | |
| October | -1.7 | -0.2 | 0.5 | |
| November | 1.5 | 2.2 | 0.9 | |
| December | 0.2 | -0.8 | -0.7 |
SOURCE: Bureau of Transportation Statistics
Table 2A: Freight Transportation Services Index by Month, 2012-2015
| 2012 | 2013 | 2014 | 2015 | |
|---|---|---|---|---|
| January | 112.0 | 114.2 | 116.4 | 122.8 |
| February | 112.1 | 115.2 | 117.5 | 120.9 |
| March | 111.2 | 115.5 | 119.4 | 122.8 |
| April | 111.8 | 114.8 | 120.0 | 121.7 |
| May | 112.6 | 115.6 | 120.5 | 122.3 |
| June | 113.5 | 116.2 | 119.3 | 122.1 |
| July | 113.1 | 116.1 | 121.1 | 122.8 |
| August | 112.5 | 116.6 | 121.0 | |
| September | 112.1 | 116.8 | 121.8 | |
| October | 110.2 | 116.5 | 122.4 | |
| November | 111.8 | 119.1 | 123.5 | |
| December | 112.1 | 118.1 | 122.6 |
SOURCE: Bureau of Transportation Statistics
Table 3: Freight, Passenger and Combined Transportation Services Indexes Year-to-Date Change, 2006-2015
Percent change to July from December of the previous year
| Year | Freight | Passenger | Combined |
|---|---|---|---|
| 2006 | -0.3 | 1.8 | 0.3 |
| 2007 | -1.8 | 2.3 | -0.6 |
| 2008 | 0.2 | -0.1 | 0.1 |
| 2009 | -2.0 | -0.3 | -1.5 |
| 2010 | 5.5 | 1.5 | 4.2 |
| 2011 | 1.2 | 1.8 | 1.4 |
| 2012 | -1.5 | -0.8 | -1.3 |
| 2013 | 3.6 | 0.6 | 2.7 |
| 2014 | 2.5 | 1.7 | 2.3 |
| 2015 | 0.2 | 0.9 | 0.4 |
SOURCE: Bureau of Transportation Statistics
Table 4: Freight Transportation Services Index from Year-to-Year
Percent change in the July Freight TSI
(Monthly average of 2000 = 100)
| July Freight TSI | Percent change from same month previous year | |
|---|---|---|
| 2006 | 112.0 | 0.1 |
| 2007 | 108.6 | -3.0 |
| 2008 | 110.9 | 2.1 |
| 2009 | 98.2 | -11.5 |
| 2010 | 107.0 | 9.0 |
| 2011 | 110.0 | 2.8 |
| 2012 | 113.1 | 2.9 |
| 2013 | 116.1 | 2.6 |
| 2014 | 121.1 | 4.3 |
| 2015 | 122.8 | 1.4 |
SOURCE: Bureau of Transportation Statistics
NOTE: Percent changes based on numbers prior to rounding.
Table 5: Transportation Services Indexes from Previous Years
Percent Change to 2015 (July to July)
| Since July . . . | Duration in years | Freight TSI Percent change to July 2015 | Passenger TSI Percent change to July 2015 | Combined TSI Percent change to July 2015 |
|---|---|---|---|---|
| 2014 | 1 | 1.4 | 1.8 | 1.5 |
| 2013 | 2 | 5.8 | 4.6 | 5.4 |
| 2012 | 3 | 8.6 | 6.4 | 7.9 |
| 2011 | 4 | 11.7 | 5.9 | 9.9 |
| 2010 | 5 | 14.8 | 9.0 | 13.0 |
| 2009 | 6 | 25.1 | 11.0 | 20.7 |
| 2008 | 7 | 10.8 | 5.1 | 8.9 |
| 2007 | 8 | 13.1 | 5.1 | 10.5 |
| 2006 | 9 | 9.7 | 10.3 | 9.7 |
| 2005 | 10 | 9.8 | 12.0 | 10.3 |
SOURCE: Bureau of Transportation Statistics
Table 6: Passenger Transportation Services Index Monthly Changes, 2012-2015
Percent change from previous month
| 2012 % Change | 2013 % Change | 2014 % Change | 2015 % Change | |
|---|---|---|---|---|
| January | -0.5 | 0.7 | -0.4 | -1.4 |
| February | 1.7 | 0.0 | 0.0 | -0.9 |
| March | -1.0 | -0.9 | 1.7 | 1.9 |
| April | -0.3 | 0.9 | 0.0 | 0.5 |
| May | -0.6 | -0.1 | 0.6 | 0.1 |
| June | 0.2 | 0.6 | -0.6 | 0.5 |
| July | -0.3 | -0.7 | 0.3 | 0.1 |
| August | 0.7 | 0.7 | 0.2 | |
| September | 0.0 | -0.2 | -0.2 | |
| October | -1.9 | 0.4 | 0.6 | |
| November | 1.8 | 0.7 | -1.1 | |
| December | 0.4 | -0.5 | 1.4 |
SOURCE: Bureau of Transportation Statistics
Table 7: Passenger Transportation Services Index from Year-to-Year
Percent change in the July Passenger TSI
(Monthly average of 2000 = 100)
| July Passenger TSI | Percent change from same month previous year | |
|---|---|---|
| 2006 | 110.7 | 1.5 |
| 2007 | 116.2 | 5.0 |
| 2008 | 116.2 | 0.0 |
| 2009 | 110.0 | -5.4 |
| 2010 | 112.1 | 1.9 |
| 2011 | 115.3 | 2.9 |
| 2012 | 114.8 | -0.4 |
| 2013 | 116.8 | 1.7 |
| 2014 | 119.9 | 2.7 |
| 2015 | 122.2 | 1.8 |
SOURCE: Bureau of Transportation Statistics
NOTE: Percent changes based on numbers prior to rounding.
Table 8: Combined Transportation Services Index Monthly Changes, 2012-2015
Percent change from previous month
| 2012 % Change | 2013 % Change | 2014 % Change | 2015 % Change | |
|---|---|---|---|---|
| January | -2.0 | 1.6 | -1.2 | -0.3 |
| February | 0.6 | 0.6 | 0.7 | -1.4 |
| March | -0.8 | -0.1 | 1.6 | 1.7 |
| April | 0.3 | -0.2 | 0.3 | -0.5 |
| May | 0.3 | 0.5 | 0.5 | 0.4 |
| June | 0.7 | 0.5 | -0.8 | 0.1 |
| July | -0.3 | -0.3 | 1.1 | 0.4 |
| August | -0.2 | 0.5 | 0.0 | |
| September | -0.2 | 0.0 | 0.4 | |
| October | -1.8 | 0.0 | 0.6 | |
| November | 1.6 | 1.7 | 0.3 | |
| December | 0.3 | -0.7 | -0.1 |
SOURCE: Bureau of Transportation Statistics
Table 9: Combined Transportation Services Index from Year-to-Year
Percent change in the July Combined TSI
(Monthly average of 2000 = 100)
| July Combined TSI | Percent change from same month previous year | |
|---|---|---|
| 2006 | 111.8 | 0.5 |
| 2007 | 111.1 | -0.7 |
| 2008 | 112.7 | 1.5 |
| 2009 | 101.7 | -9.8 |
| 2010 | 108.6 | 6.8 |
| 2011 | 111.6 | 2.8 |
| 2012 | 113.7 | 1.9 |
| 2013 | 116.4 | 2.4 |
| 2014 | 120.8 | 3.8 |
| 2015 | 122.7 | 1.5 |
SOURCE: Bureau of Transportation Statistics
NOTE: Percent changes based on numbers prior to rounding.
Brief Explanation of the TSI
The Transportation Services Index (TSI) is a measure of the month-to-month changes in the output of services provided by the for-hire transportation industries. The freight index measure changes in freight shipments while the passenger index measures changes in passenger travel.
The TSI tells us how the output of transportation services has increased or decreased from month to month. The index can be examined together with other economic indicators to produce a better understanding of the current and future course of the economy. The movement of the index over time can be compared with other economic measures to understand the relationship of changes in transportation output to changes in Gross Domestic Product (GDP).
The freight transportation index consists of:
For-hire trucking,
Railroad freight services (including rail based intermodal shipments such as containers on flat cars),
Inland waterways transportation,
Pipeline transportation (including principally petroleum and petroleum products and natural gas), and
Air freight.
The index does not include international or coastal waterborne movements, private trucking, courier services, or the US Postal Service.
The passenger transportation index consists of:
Local transit,
Intercity passenger rail, and
Passenger air transportation.
The index does not include intercity bus, sightseeing services, ferry services, taxi service, private automobile usage, or bicycling and other non-motorized transportation.