


The June 2026 Freight Transportation Services Index (TSI) Fell 0.3% from May 2026 and Fell 1.7% from June 2025
BTS 26-64
This release is published on a fixed schedule as required by the Office of Management and Budget, and statistics in this release may be revised when inputs to the statistics are corrected or updated. Data on the program page of this website are the most up-to-date and complete.
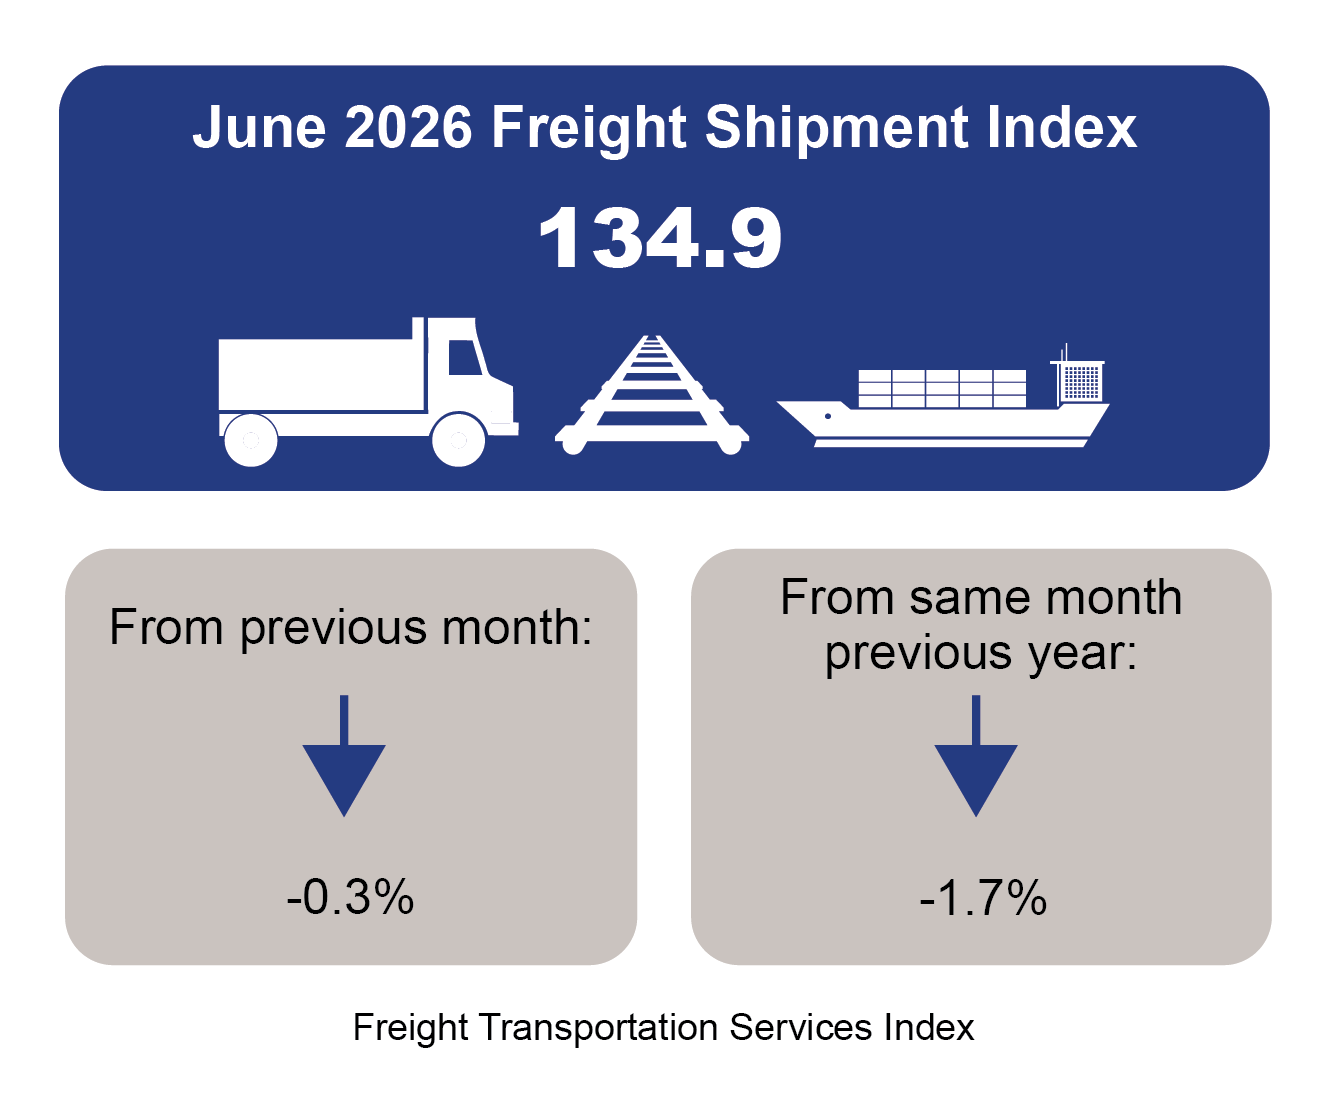
The Freight Transportation Services Index (TSI), fell 0.3% in June from May, falling for the third consecutive month, according to the U.S. Department of Transportation Bureau of Transportation Statistics (BTS). From June 2025 to June 2026 the index fell 1.7%. The Freight TSI measures the amount of freight carried by the for-hire transportation industry.
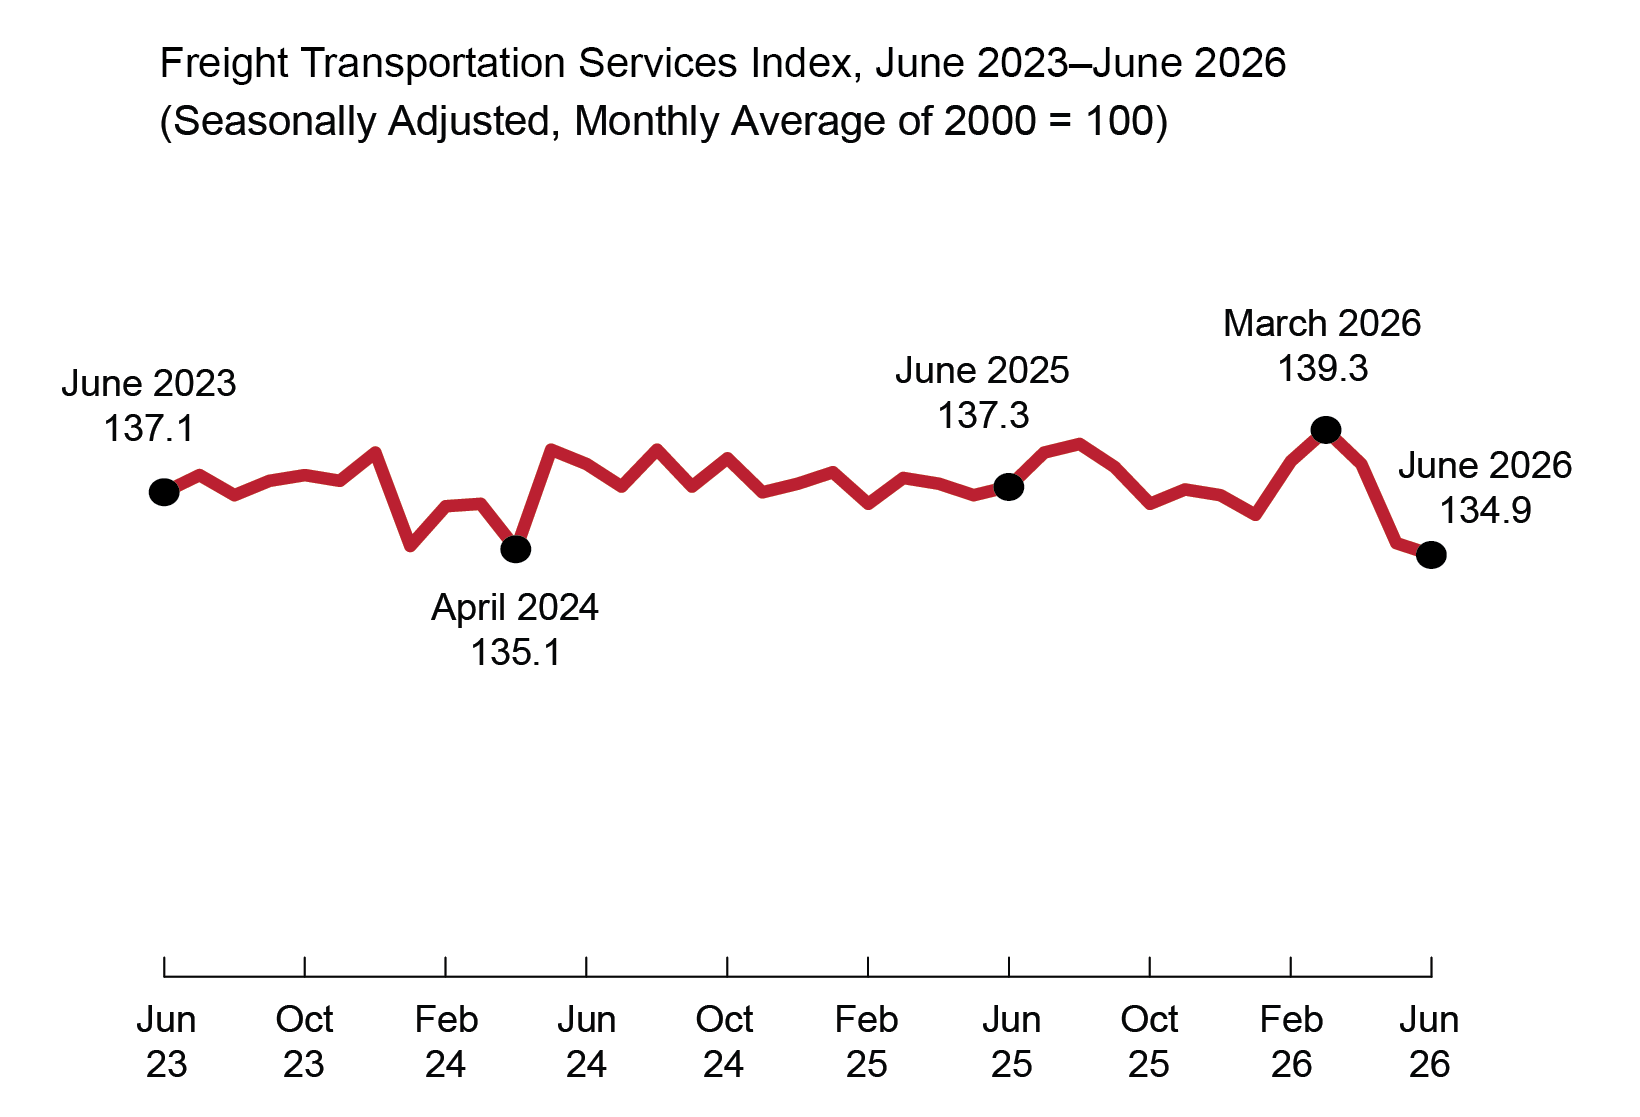
Freight Transportation Services Index, June 2023 - June 2026
| Month | Freight TSI |
|---|---|
| Jun-23 | 137.1 |
| Jul-23 | 137.7 |
| Aug-23 | 137.0 |
| Sep-23 | 137.5 |
| Oct-23 | 137.7 |
| Nov-23 | 137.5 |
| Dec-23 | 138.5 |
| Jan-24 | 135.2 |
| Feb-24 | 136.6 |
| Mar-24 | 136.7 |
| Apr-24 | 135.1 |
| May-24 | 138.6 |
| Jun-24 | 138.1 |
| Jul-24 | 137.3 |
| Aug-24 | 138.6 |
| Sep-24 | 137.3 |
| Oct-24 | 138.3 |
| Nov-24 | 137.1 |
| Dec-24 | 137.4 |
| Jan-25 | 137.8 |
| Feb-25 | 136.7 |
| Mar-25 | 137.6 |
| Apr-25 | 137.4 |
| May-25 | 137.0 |
| Jun-25 | 137.3 |
| Jul-25 | 138.5 |
| Aug-25 | 138.8 |
| Sep-25 | 138.0 |
| Oct-25 | 136.7 |
| Nov-25 | 137.2 |
| Dec-25 | 137.0 |
| Jan-26 | 136.3 |
| Feb-26 | 138.2 |
| Mar-26 | 139.3 |
| Apr-26 | 138.1 |
| May-26 | 135.3 |
| Jun-26 | 134.9 |
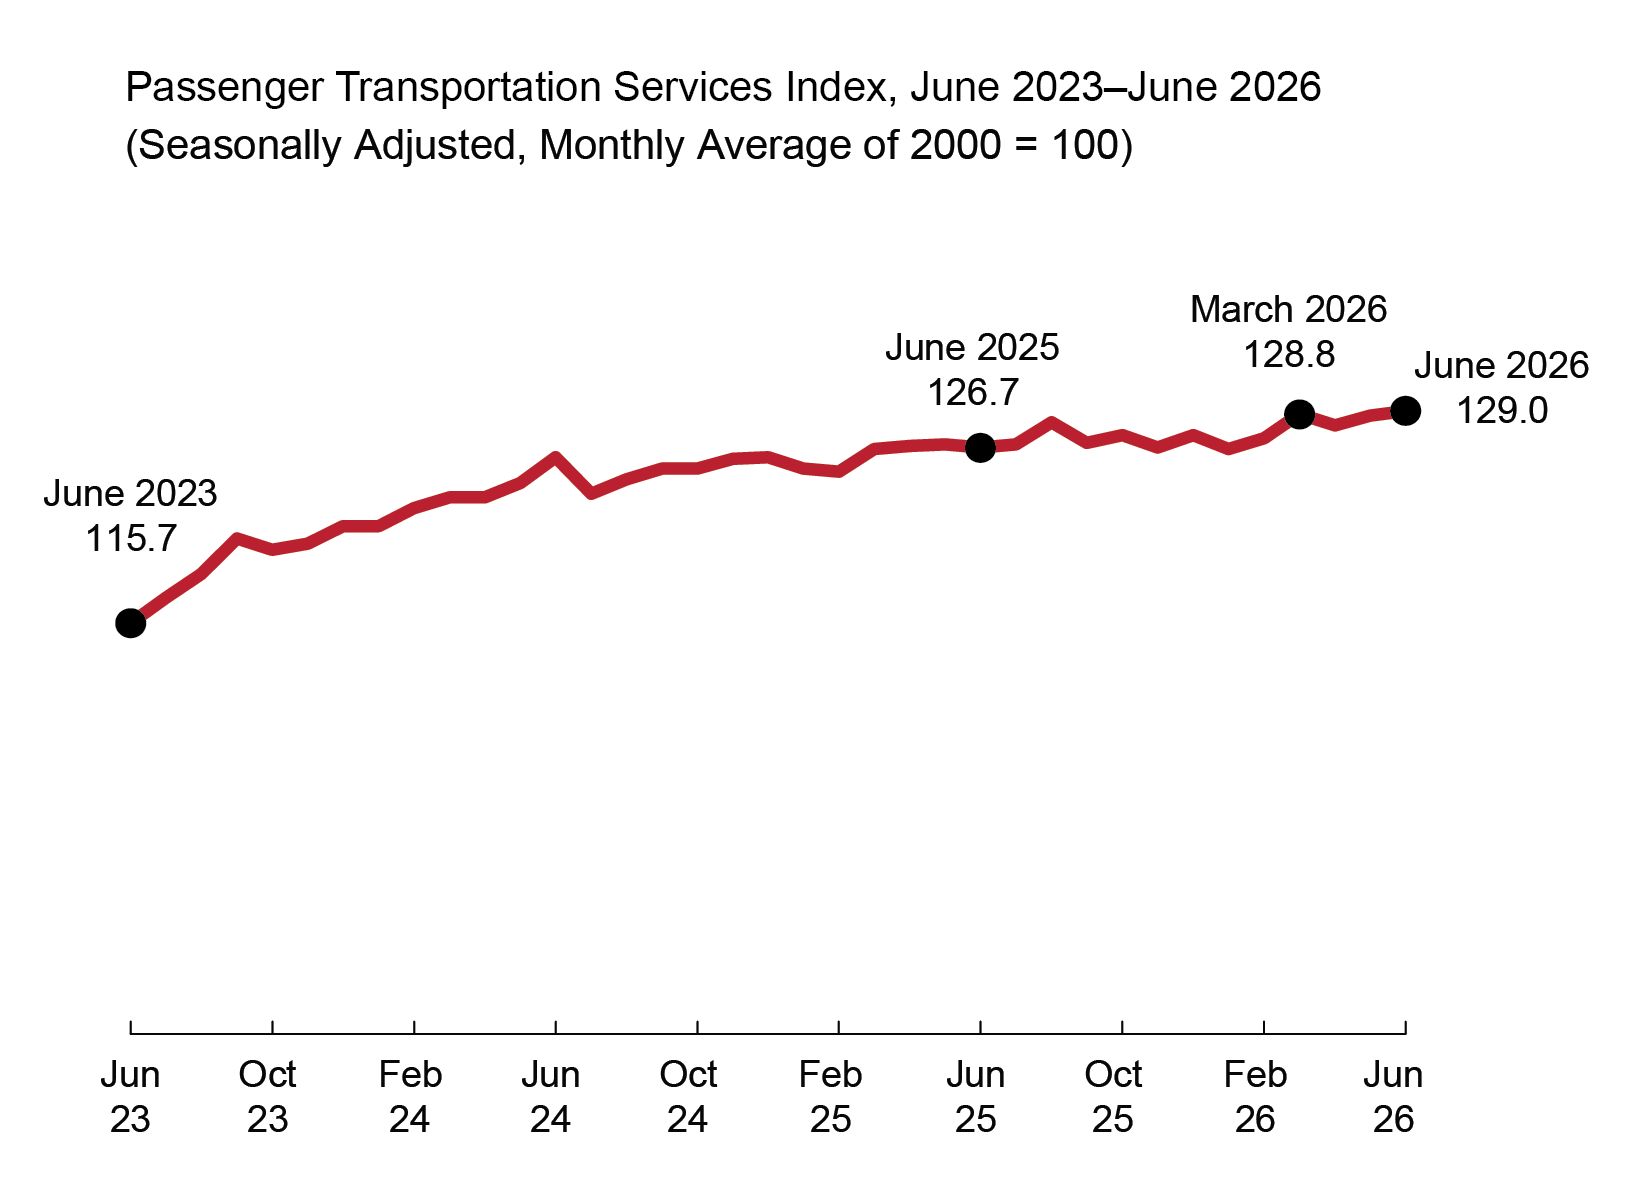
The Passenger TSI rose 0.2% in June from May, rising for the second consecutive month. From June 2025 to June 2026 the index rose 1.8%. The passenger TSI measures passenger transportation volumes on local transit, intercity rail, and air transportation. The Combined Freight and Passenger Index fell by 0.1% in June from May and fell by 0.4% from June 2025 to June 2026.
Analysis:
The Freight TSI decreased in June due to decreases in air freight, rail carloads, pipeline, and water while rail intermodal and trucking volumes increased.
The passenger index increased in June 2026 due to increases in rail passenger and transit volumes while air passenger remained unchanged. The June 2026 increase in the Passenger TSI brought it to a new high for 2026 but 5.8% below the all-time high in January 2020.
The table below shows Freight TSI and its changes in the context of other important monthly economic indicators. The table shows seasonally adjusted indicators unless noted.
The Freight TSI in Comparison to Other Economic Indicators
Economic Indicator | April | May | June |
| Freight Transportation Services Index | 138.1 | 135.3 | 134.9 |
Percent Change | -0.9 | -2.0 | -0.3 |
| Federal Reserve Board (FRB) Industrial Production Index | 102.4 | 102.6 | 102.6 |
Percent Change | 0.8 | 0.1 | 0.1 |
FRB Manufacturing (percent change) | 0.7 | 0.1 | 0.0 |
FRB Mining (percent change) | 1.3 | 1.1 | 0.4 |
FRB Utilities (percent change) | 0.8 | -0.7 | 0.4 |
| Housing Starts (thousands of units) | 1,414.0 | 1,199.0 | 1,427.0 |
Percent Change | -7.1 | -15.2 | 19.0 |
| Retail Sales: Retail Trade (millions of nominal dollars) | 657,830.0 | 664,439.0 | NA |
Percent Change | 0.6 | 1.0 | NA |
| Personal Income (billions of chained 2017 dollars) | 20,435.5 | 20,480.6 | 20,544.6 |
Percent Change | -0.3 | 0.2 | 0.3 |
| Institute for Supply Management Manufacturing Index (percent) | 52.7 | 54.0 | 53.3 |
| (50+ = expansion) | |||
Percentage Point Change | 0.0 | 1.3 | -0.7 |
BTS estimates pipeline petroleum, air freight, and air passenger one month ahead of reported data (i.e., the pipeline and air data are available through May, BTS estimates the June pipeline petroleum, air freight, and air passenger in the June index).
Revisions:
Monthly data has changed from previous releases due to the use of concurrent seasonal analysis, which results in seasonal analysis factors changing as each month’s data are added. BTS revised the May freight index to 135.3 from 136.7 in last month's release and the May passenger index to 128.7 from 127.0.
BTS scheduled the release of the July 2026 index for September 9, 2026.
See Seasonally-Adjusted Transportation Data for historical data from 2000 to the present and numbers for individual modes. The TSI and modal data also can be found on the FRED database. See Transportation as an Economic Indicator: Transportation Services Index for charts and discussion about the TSI and its relationship to the economy. The BTS report, Transportation Services Index and the Economy, provides a detailed explanation about the relationship between the TSI and economic cycles.
Looking for tables? BTS moved all tables online to streamline the monthly release.
Brief Explanation of the TSI
The TSI measures the month-to-month changes in the output of services provided by the for-hire transportation industries. The freight index measure changes in freight shipments while the passenger index measures changes in passenger travel.
The TSI tells us how the output of transportation services increased or decreased from month to month. The index can be examined together with other economic indicators to produce a better understanding of the current and future course of the economy. The movement of the index over time can be compared with other economic measures to understand the relationship of changes in transportation output to changes in Gross Domestic Product.
The freight transportation index consists of:
- For-hire trucking,
- Railroad freight services (including rail based intermodal shipments such as containers on flat cars),\
- Inland waterways transportation,
- Pipeline transportation (including principally petroleum and petroleum products and natural gas), and
- Air freight.
The index does not include international or coastal waterborne movements, private trucking, courier services, or the US Postal Service.
The passenger transportation index consists of:
- Local transit,
- Intercity passenger rail, and
- Passenger air transportation.
The index does not include intercity bus, sightseeing services, ferry services, taxi service, private automobile usage, or bicycling and other non-motorized transportation.
The TSI includes only domestic "for-hire" freight and passenger transportation. For-hire transportation consists of freight or passenger transport services provided by a firm to external customers for a fee. The TSI does not include taxi services, paid ride services in personal motor vehicles (e.g., Uber, Lyft, etc.), intercity bus services, in-house transportation (vehicles owned and operated by private firms for their own use), or noncommercial passenger travel (e.g., trips in the household car).