
June Airline Industry Employment Up Less than 1% from May
Contact: BTSNews@dot.gov
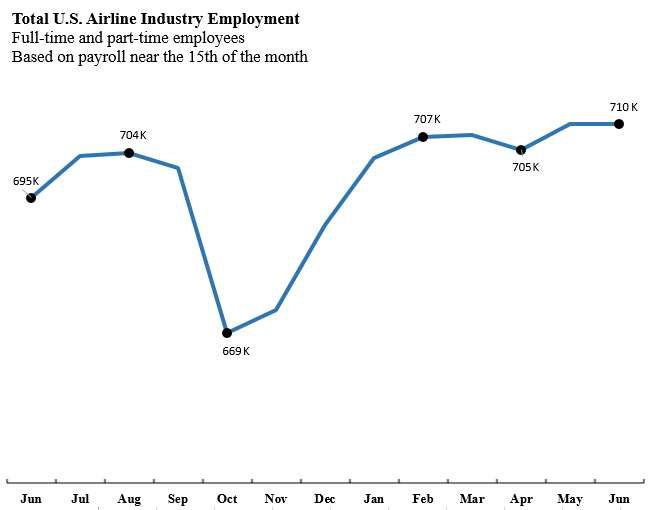
U.S. airlines employed 709,678 workers in June 2021, 48 more than in May 2021 (709,630) and 39,349 fewer than in March 2020 (749,027).
The June industry numbers consist of 599,050 full-time and 110,628 part-time workers.
From the onset of the pandemic in March 2020 through June 2021, the largest passenger airlines dropped 55,920 employees: United Airlines, -22,467; Delta Air Lines, -21,647; and American Airlines, -10,368. During that time, major cargo airlines added 22,594 employees with Federal Express adding 23,337.
Regulations require airlines to report employment numbers to the Bureau of Transportation Statistics for employees who worked or received pay for any part of the pay period(s) ending nearest the 15th day of the month. Numbers include all paid employees but do not include employees not being paid.
Total employment (full-time + part-time) by U.S. airlines (passenger + cargo carriers):
June 2020 695,373 (revised)
May 2021 709,630 (revised)
June 2021 709,678
Major Airlines' Total Employees, March 2020 and June 2021
Includes Full-time and Part-time Employees
|
|
Mar-20 |
Jun-21 |
Change in Employees |
Percent Change |
|
Alaska |
17,912 |
16,770 |
-1,142 |
-6.4% |
|
Allegiant |
4,487 |
4,349 |
-138 |
-3.1% |
|
American |
109,108 |
98,740 |
-10,368 |
-9.5% |
|
Atlas |
3,121 |
3,579 |
458 |
14.7% |
|
Delta |
89,980 |
68,333 |
-21,647 |
-24.1% |
|
Envoy |
16,781 |
15,447 |
-1,334 |
-7.9% |
|
Federal Express |
245,010 |
268,347 |
23,337 |
9.5% |
|
Frontier |
5,181 |
5,178 |
-3 |
-0.1% |
|
Hawaiian |
7,492 |
6,033 |
-1,459 |
-19.5% |
|
JetBlue |
21,546 |
18,993 |
-2,553 |
-11.8% |
|
Kalitta |
2,013 |
2,268 |
255 |
12.7% |
|
Polar Air Cargo |
226 |
250 |
24 |
10.6% |
|
Republic |
6,519 |
5,745 |
-774 |
-11.9% |
|
SkyWest |
20,544 |
14,604 |
-5,940 |
-28.9% |
|
Southwest |
62,081 |
55,293 |
-6,788 |
-10.9% |
|
Spirit |
9,213 |
9,260 |
47 |
0.5% |
|
United |
91,563 |
69,096 |
-22,467 |
-24.5% |
|
United Parcel Service |
6,279 |
6,591 |
312 |
5.0% |
|
Major Airline Total |
719,056 |
668,876 |
-50,180 |
-7.0% |
Source: Bureau of Transportation Statistics, Airline Employment Data (P1a)
Major Carrier: Over $1 billion annual operating revenue
Additional individual airline numbers are available on the BTS airline employment web page. The web page provides full-time and part-time employment numbers by carrier by month from 1990 through June 2021.
Reports are from all U.S. airlines including scheduled passenger, charter and cargo that meet the reporting standard. Airlines that operate at least one aircraft that has more than 60 seats or the capacity to carry a payload of passengers, cargo and fuel weighing more than 18,000 pounds must report monthly employment statistics.
The next web update for full-time and part-time employment is scheduled for Sept. 8. The BTS press release on full-time equivalent employment for scheduled passenger airlines through June, with historic comparisons and summary tables will be issued Aug. 16.
-END-