
March 2020 U.S. Passenger Airline Employment Data
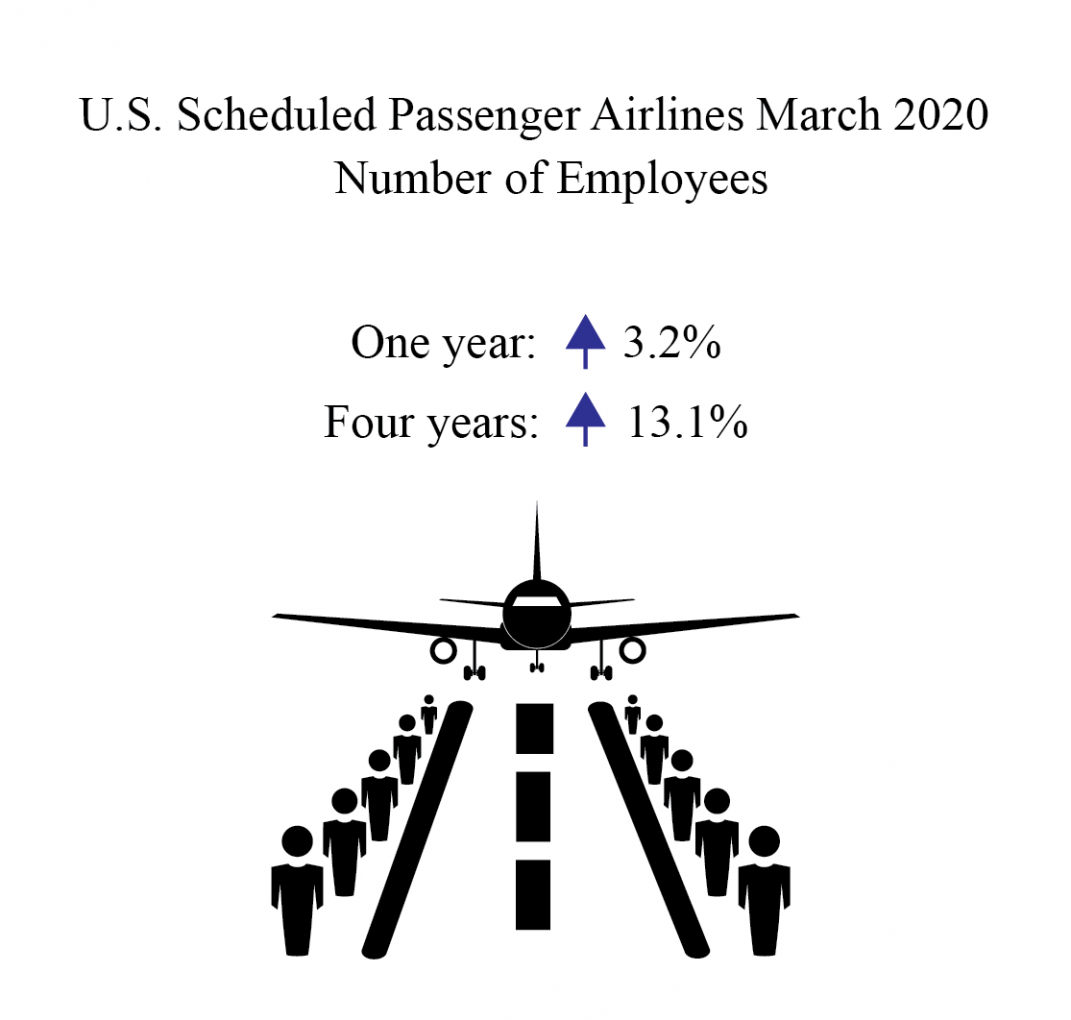
The 22 U.S. scheduled passenger airlines employed 3.2% more workers in March 2020 than in March 2019:
- March’s 459,190 full-time equivalents (FTEs) was up 3.2% from February 2020 (458,832 FTEs) and was the highest FTE total for any month since February 2003 (460,852 FTEs).
- March was the 77th consecutive month that U.S. scheduled passenger airline FTEs exceeded the same month of the previous year.
Regulations require U.S. airlines to report employment numbers for employees who worked or received pay for any part of the pay period(s) ending nearest the 15th day of the month. Employment reports are filed monthly with the Bureau of Transportation Statistics. See the tables that accompany this release on the BTS website for detailed data since 2015 (Tables 1-15) and industry summary data since 1990.
Reductions in airline travel in response to COVID-19 concerns started after the middle of March and are not reflected in the employment data reported for a pay period nearest March 15.
Employees at U.S. Scheduled Passenger Airlines Month of March, 1990-2020
| March FTEs in thousands (000) | 1 | |
|---|---|---|
| 1990 | 450.0 | 2 |
| 1991 | 438.5 | 3 |
| 1992 | 444.8 | 4 |
| 1993 | 440.1 | 5 |
| 1994 | 433.7 | 6 |
| 1995 | 428.6 | 7 |
| 1996 | 436.2 | 8 |
| 1997 | 447.5 | 9 |
| 1998 | 463.9 | 10 |
| 1999 | 488.9 | 11 |
| 2000 | 501.9 | 12 |
| 2001 | 536.3 | 13 |
| 2002 | 461.4 | 14 |
| 2003 | 458.6 | 15 |
| 2004 | 436.7 | 16 |
| 2005 | 427.1 | 17 |
| 2006 | 404.4 | 18 |
| 2007 | 407.5 | 19 |
| 2008 | 416.9 | 20 |
| 2009 | 392.1 | 21 |
| 2010 | 377.8 | 22 |
| 2011 | 383.3 | 23 |
| 2012 | 388.1 | 24 |
| 2013 | 380.5 | 25 |
| 2014 | 383.6 | 26 |
| 2015 | 390.8 | 27 |
| 2016 | 406.0 | 28 |
| 2017 | 422.3 | 29 |
| 2018 | 434.2 | 30 |
| 2019 | 445.0 | 31 |
| 2020 | 459.2 | 32 |
| 33 |
FTE calculations count two part-time employees as one full-time employee.
Bureau of Transportation Statistics
See the tables that accompany this release on the BTS website for detailed data since 2015 (Tables 1-15) and industry summary data since 1990.
All 22 scheduled service passenger airlines
- 459,190 FTEs
- Up 3.2% (14,223 FTEs) from March 2019 (444,967 FTEs)
- Up 13.1% (53,207 FTEs) from March 2016 (405,983 FTEs)
Four network airlines
- 290,512 FTEs, 63.3% of total scheduled passenger airline FTEs
- Up 1.5% (4,313 FTEs) from March 2019 (286,199 FTEs)
- Up 8.2% (22,137 FTEs) from March 2016 (268,375 FTEs)
Network airlines operate a significant portion of their flights using at least one hub where connections are made for flights to down-line destinations or spoke cities. Note that beginning with January 2018 data, Virgin America’s numbers are included with Alaska Airlines in the network category.
Five low-cost airlines
- 98,531 FTEs, 21.5% of total scheduled passenger airline FTEs
- Up 4.5% (4,228 FTEs) from March 2019 (94,303 FTEs)
- Up 22.9% (18,329 FTEs) from March 2016 (80,202 FTEs)
Low-cost airlines operate under a low-cost business model, with infrastructure and aircraft operating costs below the overall industry average.
10 regional airlines
- 61,003 FTEs, 13.3% of total scheduled passenger airline FTEs
- Up 8.2% (4,623 FTEs) from March 2019 (56,380 FTEs)
- Up 21.0% (10,579 FTEs) from March 2016 (50,424 FTEs)
Regional carriers typically provide service from small cities, using primarily regional jets to support the network carriers’ hub and spoke systems.
Top Employers by Group
- Network: American 102,544 FTEs
- Low-Cost: Southwest 60,922 FTEs
- Regional: SkyWest 17,938 FTEs
Three other airlines
Other carriers generally operate within specific niche markets. They are: Hawaiian Airlines, Sun Country Airlines and Silver Airlines.
Reporting Notes
Airlines that operate at least one aircraft that has more than 60 seats or the capacity to carry a payload of passengers, cargo and fuel weighing more than 18,000 pounds must report monthly employment statistics.
Data are compiled from monthly reports filed with BTS by commercial air carriers as of May 7. Additional airline employment data and previous releases can be found on the BTS website. BTS has scheduled release of April passenger airline employment data for June 16.