
March Airline Industry Employment Virtually Unchanged from February
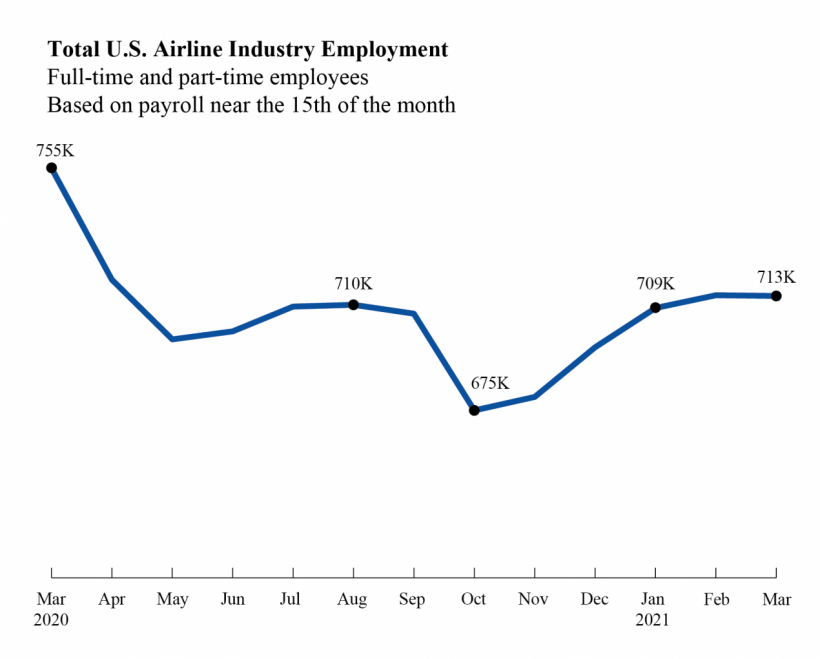
U.S. airlines employed 713,035 workers in March 2021, 221 fewer than in February 2021 (713,256) and 42,060 fewer than in March 2020 (755,095).
The March industry numbers consist of 598,378 full-time and 114,657 part-time workers.
United Airlines reported 2,767 fewer employees in March than in February. Without United’s decrease, other airlines reported a combined increase in employees from February to March.
United revised January and February numbers downward. United’s January number was revised from 76,313 to 69,111. United’s February number was revised from 70,178 to 70,058. United reported 67,291 employees in March.
Regulations require airlines to report employment numbers to the Bureau of Transportation Statistics for employees who worked or received pay for any part of the pay period(s) ending nearest the 15th day of the month. Numbers include all paid employees but do not include employees not being paid.
Total employment (full-time + part-time) by U.S. airlines (passenger + cargo carriers):
March 2020 755,095
February 2021 713,256 (revised)
March 2021 713,035
Major Airlines' Total Employees, March 2020 and March 2021
Includes Full-time and Part-time Employees
|
Mar-20 |
Mar-21 |
Change in Employees |
Percent Change |
|
|
Alaska |
17,912 |
16,673 |
-1,239 | -6.9 |
|
Allegiant |
4,487 |
4,172 |
-311 | -7.0 |
|
American |
109,108 |
101,303 |
-7,805 | -7.0 |
|
Atlas |
3,121 |
3,515 |
394 | 12.6 |
|
Delta |
89,980 |
62,227 |
-25,753 | -28.6 |
|
Envoy |
16,781 |
15,346 |
-1,435 | -8.6 |
|
Federal Express |
245,010 |
270,383 |
25,373 | 10.4 |
|
Frontier |
5,181 |
4,952 |
-235 | -4.5 |
|
Hawaiian |
7,492 |
6,049 |
-1,443 | -19.3 |
|
JetBlue |
21,546 |
18,945 |
-2,601 | -12.1 |
|
Kalitta |
2,013 |
2,283 |
270 | 13.4 |
|
Polar Air Cargo |
226 |
243 |
17 | 7.5 |
|
Republic |
6,519 |
5,550 |
-969 | -14.9 |
|
SkyWest |
20,544 |
19,777 |
-767 | -3.7 |
|
Southwest |
62,081 |
57,037 |
-5,044 | -8.1 |
|
Spirit |
9,213 |
8,820 |
-393 | -4.3 |
|
United |
91,563 |
67,291 |
-21,272 | -26.5 |
|
United Parcel Service |
6,279 |
6,524 |
245 | 3.9 |
|
Major Airline Total |
719,056 |
673,084 |
-45,972 | -6.4 |
Source: Bureau of Transportation Statistics, Airline Employment Data (P1a)
Major Carrier: Over $1 billion annual operating revenue
Additional individual airline numbers are available on the BTS airline employment web page. The web page provides full-time and part-time employment numbers by carrier by month from 1990 through March 2021.
Reports are from all U.S. airlines including scheduled passenger, charter and cargo that meet the reporting standard. Airlines that operate at least one aircraft that has more than 60 seats or the capacity to carry a payload of passengers, cargo and fuel weighing more than 18,000 pounds must report monthly employment statistics.
The next web update for full-time and part-time employment is scheduled for June 8. The BTS press release on full-time equivalent employment for scheduled passenger airlines through February, with historic comparisons and summary tables will be issued May 17.
-END-