
May 2014 U.S. Airline Traffic Data
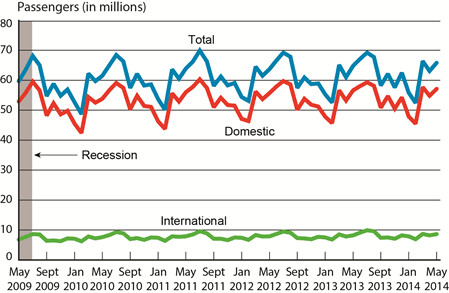
The U.S. Department of Transportation’s Bureau of Transportation Statistics (BTS) reported today that U.S. airlines carried 65.8 million systemwide (domestic + international) scheduled service passengers in May 2014, 1.5 percent more than in May 2013. The systemwide total was the result of a 1.0 percent increase in the number of passengers on domestic flights (57.1 million) and a 4.7 percent increase in passengers on U.S. airlines’ international flights (8.6 million) (Tables 1, 7, 13).
Passengers on All U.S. Scheduled Airlines (Domestic and International),
May 2009-May 2014
Source for recession dates: National Bureau of Economic Research, US Business Cycle Expansions and Contractions
U.S. airlines carried 303.4 million systemwide (domestic + international) scheduled service passengers during the first five months of 2014, 1.6 percent more than during the same period in 2013 (Table 2). Domestically, U.S. airlines carried 263.1 million passengers, up 1.2 percent from 2013 (Table 8). Internationally, they carried 40.3 million passengers, up 3.9 percent from 2013 (Table 14). See Tables 2, 8 and 14 of Air Traffic Press Releases for previous-year data.
Load Factor
The May 2014 systemwide load factor (85.0 percent) was the all-time high for the month of May, exceeding the previous high of 84.2 set in 2013. Load factor is a measure of the use of aircraft capacity that compares demand, measured in revenue passenger-miles (RPMs), as a proportion of capacity, measured in available seat-miles (ASMs). Systemwide demand grew faster from May 2013 to May 2014 (up 2.5 percent) than the growth in capacity (up 1.6 percent) (Table 1). The domestic load factor (86.3) was a record high for the month of May, topping the previous high of 84.9 set in 2013. Domestic demand grew faster from May 2013 to May 2014 (2.1 percent) than capacity (0.4 percent), resulting in the higher load factor (Table 7).
The international load factor (82.3) declined from 82.8 percent in May 2013 which was the highest May international load factor. International demand rose 3.5 percent from May 2013 to May 2014 but was outpaced by 4.2 percent growth in capacity, resulting in the lower load factor (Table 13).
Trends for the Month of May
Systemwide: For the month of May, the 2014 systemwide passenger total was the highest since 2008 but below the all-time high in May 2007. Demand, measured in RPMs, was at the highest May level, exceeding the previous high in 2013. Capacity, measured in ASMs, was at the second highest May level, below the May 2008 level.
Domestic: The May 2014 domestic passenger total was the highest since 2008 and below the all-time high in May 2007. Demand was at the highest May level, exceeding the previous high set in May 2007. Capacity was the highest since 2008 but was below the levels reached in the month of May from 2004 through 2008 and in 2001.
International: The number of passengers, demand and capacity on U.S. airlines’ international flights was the highest on record for the month of May, exceeding the previous highs in May 2013.
Additional traffic data can be found on the BTS Airlines and Airports page. Click on a link in the Quick Links box on the right. For additional U.S. carrier passenger and freight data since 1996, see Traffic on the BTS website.
Top Airlines
Monthly: In May, Delta Air Lines carried more systemwide passengers than any other U.S. airline (Table 4). Southwest Airlines carried the most passengers on domestic flights (Table 10). United Airlines carried the most passengers on international flights (Table 16). The top 10 U.S. airlines carried 82.2 percent of systemwide passengers, up from 80.4 percent carried by the U.S. airlines that were in the top 10 in May 2013.
Year-to-date: During the first five months of 2014, Delta carried more systemwide passengers than any other U.S. airline (Table 3). Southwest carried the most passengers on domestic flights (Table 9). United carried the most passengers on international flights (Table 15). The top 10 U.S. airlines carried 81.5 percent of systemwide passengers, up from 80.6 percent carried by the U.S. airlines that were in the top 10 during the first five months of 2013.
Top Airports
Monthly: In May, more total systemwide passengers boarded planes at Atlanta Hartsfield-Jackson International than at any other U.S. airport. More domestic passengers boarded planes at Atlanta than any other U.S. airport, while more international passengers boarded U.S. carriers at Miami (Tables 6, 12, 18).
Year-to-date: During the first five months of 2014, more total systemwide passengers boarded planes at Atlanta Hartsfield-Jackson International than at any other U.S. airport. More domestic passengers boarded planes at Atlanta than any other U.S. airport, while more international passengers boarded U.S. carriers at Miami (Tables 5, 11, 17).
Reporting Notes
Data are compiled from monthly reports filed with BTS by commercial U.S. air carriers detailing operations, passenger traffic and freight traffic. This release includes data received by BTS from 81 carriers as of Aug. 5 for U.S. carrier scheduled civilian operations.
Southwest and AirTran Airways are reporting as separate carriers with the exception of their financial reports. They have one FAA SOC (single operating certificate), requiring that they utilize the same safety/operating procedures, but they have separate DOT economic certificates, meaning they remain operating as separate economic entities.
Go to http://www.transtats.bts.gov/releaseinfo.asp for the complete list of reporting and non-reporting carriers. U.S. carriers’ foreign point-to-point flights are included in system and international totals. To create a customized table for passengers, flights, RPMs, ASMs and other data, including non-scheduled service, go to https://www.transtats.bts.gov/TRAFFIC/
For additional scheduled service numbers for U.S. airlines, U.S. and foreign airlines, by airline and by airport, see Passengers, Flights, Revenue Passenger-Miles, Available Seat-Miles and Load Factor.
Traffic numbers are available on the BTS website at TranStats, the Intermodal Transportation Database, at http://transtats.bts.gov. Click on “Aviation.” For systemwide passengers, RPMs and ASMs by carrier through May, click on “Air Carrier Summary Data (Form 41 and 298C Summary Data),” and then click on “Schedule T-1.” Use crosstabs to find scheduled service.
For domestic numbers through May and international numbers through February by origin as well as by carrier, click on “Aviation,” then click on “Air Carrier Statistics (Form 41 Traffic).” Click on “T-100 Market” for system passenger numbers, “T-100 Domestic Market” for domestic or “T-100 International Market” for international. For flights, stage length and trip length, use the appropriate T-100 Segment database. Use crosstabs to find scheduled service.
International totals in this press release consist of all U.S. carrier operations to and from the U.S. and from one foreign point to another foreign point. TranStats T-100 systemwide and international totals do not include those U.S. carriers’ foreign point-to-point flights. For May, U.S. carriers reported 141,414 foreign point-to-point passengers. For January through May, U.S. carriers reported 802,203 foreign point-to-point passengers.
Data are subject to revision. BTS has scheduled Sept. 15 for the release of June traffic data. None of the data are from samples so measures of statistical significance do not apply.
Table 1. Scheduled Systemwide (Domestic and International) Airline Travel on U.S. Airlines
| Monthly | Year-to-Date | |||||
|---|---|---|---|---|---|---|
| May 2013 | May 2014 | Change % | 2013 | 2014 | Change % | |
| Passengers (in millions) | 64.8 | 65.8 | 1.5 | 298.7 | 303.4 | 1.6 |
| Flights (in thousands) | 793.5 | 757.1 | -4.6 | 3,745.9 | 3,595.0 | -4.0 |
| Revenue Passenger Miles (in billions) | 73.0 | 74.8 | 2.5 | 332.9 | 341.0 | 2.4 |
| Available Seat-Miles (in billions) | 86.7 | 88.1 | 1.6 | 407.3 | 413.1 | 1.4 |
| Load Factor* | 84.2 | 85.0 | 0.8 | 81.7 | 82.5 | 0.8 |
| Flight Stage Length** | 763.1 | 790.9 | 3.6 | 764.0 | 789.6 | 3.3 |
| Passenger Trip Length*** | 1,126.6 | 1,138.1 | 1.0 | 1,114.6 | 1,123.8 | 0.8 |
Source: Bureau of Transportation Statistics, T-100 Market and Segment
* Change in load factor points
** The average non-stop distance flown per departure in miles
*** The average distance flown per passenger in miles
Note: Percentage changes based on numbers prior to rounding.
Table 2. Total Systemwide (Domestic and International) Scheduled Enplanements on U.S. Airlines
Passenger numbers in millions (000,000)
| 2012 | 2013 | 2012-2013 Pct. Change | 2014 | 2013-2014 Pct. Change | |
|---|---|---|---|---|---|
| January | 54.4 | 55.3 | 1.7 | 55.8 | 0.8 |
| February | 53.1 | 52.5 | -1.2 | 52.4 | -0.1 |
| March | 64.5 | 65.1 | 1.0 | 66.4 | 2.0 |
| April | 61.5 | 61.0 | -0.8 | 63.1 | 3.4 |
| May | 63.7 | 64.8 | 1.7 | 65.8 | 1.5 |
| June | 66.6 | 67.1 | 0.7 | ||
| July | 69.2 | 69.2 | 0.0 | ||
| August | 67.8 | 67.7 | 0.0 | ||
| September | 57.4 | 58.2 | 1.3 | ||
| October | 60.9 | 62.1 | 2.0 | ||
| November | 58.7 | 57.6 | -2.0 | ||
| December | 58.9 | 62.5 | 6.1 | ||
| 5 Mo. Total | 297.2 | 298.7 | 0.5 | 303.4 | 1.6 |
| Yr. Total | 736.7 | 743.1 | 0.9 |
Source: Bureau of Transportation Statistics, T-100 Market
Note: Percentage changes based on numbers prior to rounding.
Table 3. Top 10 U.S. Airlines, ranked by January-May 2014 Systemwide (Domestic and International) Scheduled Enplanements
Passenger numbers in millions (000,000)
| Jan-May 2014 Rank | Carrier | Jan-May 2014 Enplaned Passengers | Jan-May 2013 Rank | Jan-May 2013 Enplaned Passengers | Pct. Change 2013-2014 |
|---|---|---|---|---|---|
| 1 | Delta | 50.431 | 1 | 47.156 | 6.9 |
| 2 | Southwest* | 49.487 | 2 | 46.185 | 7.1 |
| 3 | United | 36.292 | 3 | 36.273 | 0.1 |
| 4 | American | 35.886 | 4 | 35.377 | 1.4 |
| 5 | US Airways | 23.819 | 5 | 23.503 | 1.3 |
| 6 | JetBlue | 12.745 | 7 | 12.396 | 2.8 |
| 7 | ExpressJet | 12.666 | 6 | 13.201 | -4.1 |
| 8 | SkyWest | 10.984 | 8 | 11.103 | -1.1 |
| 9 | Alaska | 8.143 | 10 | 7.802 | 4.4 |
| 10 | Envoy | 6.767 | 11 | 7.207 | -6.1 |
Source: Bureau of Transportation Statistics, T-100 Market
* The merged Southwest and AirTran are now reporting separately although operating under a single certificate.
Note: Percentage changes based on numbers prior to rounding.
Table 4. Top 10 U.S. Airlines, ranked by May 2014 Systemwide (Domestic and International) Scheduled Enplanements
Passenger numbers in millions (000,000)
| May 2014 Rank | Carrier | May 2014 Enplaned Passengers | May 2013 Rank | May 2013 Enplaned Passengers | Pct. Change 2013-2014 |
|---|---|---|---|---|---|
| 1 | Delta | 11.310 | 1 | 10.365 | 9.1 |
| 2 | Southwest* | 11.027 | 2 | 10.355 | 6.5 |
| 3 | United | 7.935 | 3 | 7.779 | 2.0 |
| 4 | American | 7.588 | 4 | 7.458 | 1.7 |
| 5 | US Airways | 5.113 | 5 | 4.958 | 3.1 |
| 6 | ExpressJet | 2.763 | 6 | 2.920 | -5.4 |
| 7 | JetBlue | 2.736 | 7 | 2.560 | 6.9 |
| 8 | SkyWest | 2.368 | 8 | 2.383 | -0.6 |
| 9 | Alaska | 1.729 | 10 | 1.664 | 3.9 |
| 10 | Envoy | 1.488 | 11 | 1.590 | -6.4 |
Source: Bureau of Transportation Statistics, T-100 Market
* The merged Southwest and AirTran are now reporting separately although operating under a single certificate.
Note: Percentage changes based on numbers prior to rounding.
Table 5. Top 10 U.S. Airports, ranked by January-May 2014 Systemwide (Domestic and International) Scheduled Enplanements on U.S. Airlines
Passenger numbers in millions (000,000)
| Jan-May 2014 Rank | Airport | Jan-May 2014 Enplaned Passengers | Jan-May 2013 Rank | Jan-May 2013 Enplaned Passengers | Pct. Change 2013-2014 |
|---|---|---|---|---|---|
| 1 | Atlanta | 18.345 | 1 | 18.037 | 1.7 |
| 2 | Dallas/Fort Worth | 11.978 | 3 | 11.506 | 4.1 |
| 3 | Chicago O'Hare | 11.861 | 2 | 11.623 | 2.0 |
| 4 | Los Angeles | 10.771 | 4 | 10.032 | 7.4 |
| 5 | Denver | 10.153 | 5 | 9.931 | 2.2 |
| 6 | Charlotte | 8.377 | 6 | 8.589 | -2.5 |
| 7 | Phoenix | 8.313 | 7 | 8.145 | 2.1 |
| 8 | Las Vegas | 7.671 | 8 | 7.515 | 2.1 |
| 9 | San Francisco | 7.647 | 10 | 7.242 | 5.6 |
| 10 | Houston Bush | 7.431 | 9 | 7.251 | 2.5 |
Source: Bureau of Transportation Statistics, T-100 Market
Note: Percentage changes based on numbers prior to rounding.
Table 6. Top 10 U.S. Airports, ranked by May 2014 Systemwide (Domestic and International) Scheduled Enplanements on U.S. Airlines
Passenger numbers in millions (000,000)
| May 2014 Rank | Airport | May 2014 Enplaned Passengers | May 2013 Rank | May 2013 Enplaned Passengers | Pct. Change 2013-2014 |
|---|---|---|---|---|---|
| 1 | Atlanta | 4.143 | 1 | 3.982 | 4.0 |
| 2 | Chicago O'Hare | 2.687 | 2 | 2.638 | 1.9 |
| 3 | Dallas/Fort Worth | 2.613 | 3 | 2.475 | 5.6 |
| 4 | Los Angeles | 2.342 | 4 | 2.220 | 5.5 |
| 5 | Denver | 2.194 | 5 | 2.150 | 2.0 |
| 6 | San Francisco | 1.732 | 8 | 1.652 | 4.8 |
| 7 | Charlotte | 1.705 | 6 | 1.869 | -8.8 |
| 8 | Phoenix | 1.666 | 7 | 1.681 | -0.9 |
| 9 | Las Vegas | 1.644 | 9 | 1.641 | 0.2 |
| 10 | Houston Bush | 1.603 | 10 | 1.552 | 3.3 |
Source: Bureau of Transportation Statistics, T-100 Market
Note: Percentage changes based on numbers prior to rounding.
Table 7. Domestic Scheduled Airline Travel on U.S. Airlines
| Monthly | Year-to-Date | |||||
|---|---|---|---|---|---|---|
| May 2013 | May 2014 | Change % | 2013 | 2014 | Change % | |
| Passengers (in millions) | 56.6 | 57.1 | 1.0 | 259.9 | 263.1 | 1.2 |
| Flights (in thousands) | 721.1 | 683.0 | -5.3 | 3,393.3 | 3,235.9 | -4.6 |
| Revenue Passenger Miles (in billions) | 50.1 | 51.2 | 2.1 | 231.1 | 236.2 | 2.2 |
| Available Seat-Miles (in billions) | 59.1 | 59.3 | 0.4 | 279.8 | 281.2 | 0.5 |
| Load Factor* | 84.9 | 86.3 | 1.4 | 82.6 | 84.0 | 1.4 |
| Flight Stage Length** | 651.2 | 671.0 | 3.0 | 655.3 | 674.4 | 2.9 |
| Passenger Trip Length*** | 886.2 | 895.6 | 1.1 | 889.2 | 897.8 | 1.0 |
Source: Bureau of Transportation Statistics, T-100 Domestic Market and Segment
* Change in load factor points
** The average non-stop distance flown per departure in miles
*** The average distance flown per passenger in miles
Note: Percentage changes based on numbers prior to rounding.
Table 8. Domestic Scheduled Enplanements on U.S. Airlines
Passenger numbers in millions (000,000)
| 2012 | 2013 | 2012-2013 Pct. Change | 2014 | 2013-2014 Pct. Change | |
|---|---|---|---|---|---|
| January | 47.1 | 47.8 | 1.6 | 47.9 | 0.3 |
| February | 46.4 | 45.7 | -1.4 | 45.5 | -0.5 |
| March | 56.2 | 56.6 | 0.6 | 57.7 | 2.1 |
| April | 53.7 | 53.2 | -0.9 | 54.8 | 3.0 |
| May | 55.7 | 56.6 | 1.5 | 57.1 | 1.0 |
| June | 57.9 | 58.0 | 0.1 | ||
| July | 59.7 | 59.3 | -0.6 | ||
| August | 58.6 | 58.1 | -0.9 | ||
| September | 50.1 | 50.8 | 1.3 | ||
| October | 53.8 | 54.7 | 1.7 | ||
| November | 51.8 | 50.5 | -2.5 | ||
| December | 51.2 | 54.3 | 6.2 | ||
| 5 Mo. Total | 259.1 | 259.9 | 0.3 | 263.1 | 1.2 |
| Yr. Total | 642.3 | 645.6 | 0.5 |
Source: Bureau of Transportation Statistics, T-100 Domestic Market
Note: Percentage changes based on numbers prior to rounding.
Table 9. Top 10 U.S. Airlines, ranked by January-May 2014 Domestic Scheduled Enplanements
Passenger numbers in millions (000,000)
| Jan-May 2014 Rank | Carrier | Jan-May 2014 Enplaned Passengers | Jan-May 2013 Rank | Jan-May 2013 Enplaned Passengers | Pct. Change 2013-2014 |
|---|---|---|---|---|---|
| 1 | Southwest* | 49.487 | 1 | 46.185 | 7.1 |
| 2 | Delta | 41.507 | 2 | 38.842 | 6.9 |
| 3 | American | 27.050 | 3 | 26.702 | 1.3 |
| 4 | United | 25.938 | 4 | 26.227 | -1.1 |
| 5 | US Airways | 20.963 | 5 | 20.601 | 1.8 |
| 6 | ExpressJet | 11.405 | 6 | 12.025 | -5.2 |
| 7 | JetBlue | 10.608 | 7 | 10.610 | 0.0 |
| 8 | SkyWest | 10.340 | 8 | 10.508 | -1.6 |
| 9 | Alaska | 7.319 | 10 | 7.010 | 4.4 |
| 10 | Envoy | 6.194 | 11 | 6.500 | -4.7 |
Source: Bureau of Transportation Statistics, T-100 Domestic Market
* The merged Southwest and AirTran are now reporting separately although operating under a single certificate.
Note: Percentage changes based on numbers prior to rounding.
Table 10. Top 10 U.S. Airlines, ranked by May 2014 Domestic Scheduled Enplanements
Passenger numbers in millions (000,000)
| May 2014 Rank | Carrier | May 2014 Enplaned Passengers | May 2013 Rank | May 2013 Enplaned Passengers | Pct. Change 2013-2014 |
|---|---|---|---|---|---|
| 1 | Southwest* | 11.027 | 1 | 10.355 | 6.5 |
| 2 | Delta | 9.364 | 2 | 8.522 | 9.9 |
| 3 | American | 5.767 | 3 | 5.662 | 1.9 |
| 4 | United | 5.677 | 4 | 5.619 | 1.0 |
| 5 | US Airways | 4.454 | 5 | 4.314 | 3.2 |
| 6 | ExpressJet | 2.498 | 6 | 2.664 | -6.2 |
| 7 | JetBlue | 2.274 | 8 | 2.205 | 3.1 |
| 8 | SkyWest | 2.213 | 7 | 2.253 | -1.8 |
| 9 | Alaska | 1.578 | 10 | 1.516 | 4.0 |
| 10 | Envoy | 1.366 | 11 | 1.443 | -5.3 |
Source: Bureau of Transportation Statistics, T-100 Domestic Market
* The merged Southwest and AirTran are now reporting separately although operating under a single certificate.
Note: Percentage changes based on numbers prior to rounding.
Table 11. Top 10 U.S. Airports, ranked by January-May 2014 Domestic Scheduled Enplanements
Passenger numbers in millions (000,000)
| Jan-May 2014 Rank | Airport | Jan-May 2014 Enplaned Passengers | Jan-May 2013 Rank | Jan-May 2013 Enplaned Passengers | Pct. Change 2013-2014 |
|---|---|---|---|---|---|
| 1 | Atlanta | 16.507 | 1 | 16.342 | 1.0 |
| 2 | Dallas/Fort Worth | 10.856 | 2 | 10.487 | 3.5 |
| 3 | Chicago O'Hare | 10.684 | 3 | 10.484 | 1.9 |
| 4 | Los Angeles | 9.865 | 5 | 9.254 | 6.6 |
| 5 | Denver | 9.789 | 4 | 9.659 | 1.3 |
| 6 | Phoenix | 7.996 | 7 | 7.812 | 2.4 |
| 7 | Charlotte | 7.784 | 6 | 8.010 | -2.8 |
| 8 | Las Vegas | 7.664 | 8 | 7.509 | 2.1 |
| 9 | San Francisco | 6.888 | 9 | 6.535 | 5.4 |
| 10 | Orlando | 6.496 | 10 | 6.512 | -0.2 |
Source: Bureau of Transportation Statistics, T-100 Domestic Market
Note: Percentage changes based on numbers prior to rounding.
Table 12. Top 10 U.S. Airports, ranked by May 2014 Domestic Scheduled Enplanements
Passenger numbers in millions (000,000)
| May 2014 Rank | Airport | May 2014 Enplaned Passengers | May 2013 Rank | May 2013 Enplaned Passengers | Pct. Change 2013-2014 |
|---|---|---|---|---|---|
| 1 | Atlanta | 3.726 | 1 | 3.592 | 3.7 |
| 2 | Chicago O'Hare | 2.395 | 2 | 2.367 | 1.2 |
| 3 | Dallas/Fort Worth | 2.366 | 3 | 2.248 | 5.3 |
| 4 | Los Angeles | 2.149 | 5 | 2.051 | 4.8 |
| 5 | Denver | 2.126 | 4 | 2.098 | 1.3 |
| 6 | Las Vegas | 1.643 | 7 | 1.640 | 0.2 |
| 7 | Phoenix | 1.606 | 8 | 1.618 | -0.7 |
| 8 | Charlotte | 1.560 | 6 | 1.732 | -9.9 |
| 9 | San Francisco | 1.545 | 9 | 1.470 | 5.1 |
| 10 | Orlando | 1.327 | 10 | 1.310 | 1.3 |
Source: Bureau of Transportation Statistics, T-100 Domestic Market
Note: Percentage changes based on numbers prior to rounding.
Table 13. International Scheduled Airline Travel on U.S. Airlines
| Monthly | Year-to-Date | |||||
|---|---|---|---|---|---|---|
| May 2013 | May 2014 | Change % | 2013 | 2014 | Change % | |
| Passengers (in millions) | 8.2 | 8.6 | 4.7 | 38.8 | 40.3 | 3.9 |
| Flights (in thousands) | 72.3 | 74.1 | 2.5 | 352.6 | 359.1 | 1.8 |
| Revenue Passenger Miles (in billions) | 22.9 | 23.7 | 3.5 | 101.8 | 104.8 | 2.9 |
| Available Seat-Miles (in billions) | 27.6 | 28.7 | 4.2 | 127.5 | 131.9 | 3.5 |
| Load Factor* | 82.8 | 82.3 | -0.5 | 79.9 | 79.4 | -0.5 |
| Flight Stage Length** | 1,879.9 | 1,895.3 | 0.8 | 1,809.9 | 1,827.3 | 1.0 |
| Passenger Trip Length*** | 2,780.1 | 2,747.4 | -1.2 | 2,624.6 | 2,599.0 | -1.0 |
Source: Bureau of Transportation Statistics, T-100 International Market and Segment
* Change in load factor points
** The average non-stop distance flown per departure in miles
*** The average distance flown per passenger in miles
Note: Percentage changes based on numbers prior to rounding.
Table 14. International Scheduled Enplanements on U.S. Airlines
Passenger numbers in millions (000,000)
| 2012 | 2013 | 2012-2013 Pct. Change | 2014 | 2013-2014 Pct. Change | |
|---|---|---|---|---|---|
| January | 7.4 | 7.5 | 2.3 | 7.9 | 4.3 |
| February | 6.7 | 6.8 | 0.8 | 6.9 | 2.6 |
| March | 8.3 | 8.5 | 3.3 | 8.7 | 1.7 |
| April | 7.8 | 7.8 | -0.6 | 8.2 | 6.2 |
| May | 7.9 | 8.2 | 3.7 | 8.6 | 4.7 |
| June | 8.7 | 9.1 | 4.3 | ||
| July | 9.5 | 9.9 | 4.3 | ||
| August | 9.1 | 9.6 | 5.5 | ||
| September | 7.3 | 7.4 | 1.9 | ||
| October | 7.2 | 7.5 | 4.2 | ||
| November | 6.9 | 7.1 | 2.3 | ||
| December | 7.7 | 8.2 | 5.9 | ||
| 5 Mo. Total | 38.1 | 38.8 | 1.9 | 40.3 | 3.9 |
| Yr. Total | 94.4 | 97.5 | 3.3 |
Source: Bureau of Transportation Statistics, T-100 International Market
Note: Percentage changes based on numbers prior to rounding.
Table 15. Top 10 U.S. Airlines, ranked by January-May 2014 International Scheduled Enplanements
Passenger numbers in thousands (000)
| Jan-May 2014 Rank | Carrier | Jan-May 2014 Enplaned Passengers | Jan-May 2013 Rank | Jan-May 2013 Enplaned Passengers | Pct. Change 2013-2014 |
|---|---|---|---|---|---|
| 1 | United | 10,354.0 | 1 | 10,046.3 | 3.1 |
| 2 | Delta | 8,924.1 | 3 | 8,314.2 | 7.3 |
| 3 | American | 8,836.0 | 2 | 8,674.9 | 1.9 |
| 4 | US Airways | 2,856.1 | 4 | 2,901.9 | -1.6 |
| 5 | JetBlue | 2,137.2 | 5 | 1,786.2 | 19.6 |
| 6 | ExpressJet | 1,260.6 | 6 | 1,176.3 | 7.2 |
| 7 | Alaska | 824.0 | 7 | 791.4 | 4.1 |
| 8 | AirTran* | 787.0 | 9 | 681.8 | 15.4 |
| 9 | SkyWest | 644.4 | 10 | 594.4 | 8.4 |
| 10 | Spirit | 596.8 | 11 | 515.9 | 15.7 |
Source: Bureau of Transportation Statistics, T-100 International Market
* The merged Southwest and AirTran are now reporting separately although operating under a single certificate.
Note: Percentage changes based on numbers prior to rounding.
Table 16. Top 10 U.S. Airlines, ranked by May 2014 International Scheduled Enplanements
Passenger numbers in thousands (000)
| May 2014 Rank | Carrier | May 2014 Enplaned Passengers | May 2013 Rank | May 2013 Enplaned Passengers | Pct. Change 2013-2014 |
|---|---|---|---|---|---|
| 1 | United | 2,258.3 | 1 | 2,160.2 | 4.5 |
| 2 | Delta | 1,946.4 | 2 | 1,843.3 | 5.6 |
| 3 | American | 1,821.0 | 3 | 1,796.5 | 1.4 |
| 4 | US Airways | 659.0 | 4 | 644.2 | 2.3 |
| 5 | JetBlue | 462.0 | 5 | 355.1 | 30.1 |
| 6 | ExpressJet | 264.7 | 6 | 255.5 | 3.6 |
| 7 | AirTran* | 158.4 | 9 | 143.3 | 10.6 |
| 8 | SkyWest | 155.0 | 10 | 130.2 | 19.0 |
| 9 | Alaska | 151.6 | 8 | 147.3 | 2.9 |
| 10 | Spirit | 134.3 | 11 | 110.6 | 21.4 |
Source: Bureau of Transportation Statistics, T-100 International Market
* The merged Southwest and AirTran are now reporting separately although operating under a single certificate.
Note: Percentage changes based on numbers prior to rounding.
Table 17. Top 10 U.S. Airports, ranked by January-May 2014 International Scheduled Enplanements on U.S. Airlines
Passenger numbers in thousands (000)
| Jan-May 2014 Rank | Airport | Jan-May 2014 Enplaned Passengers | Jan-May 2013 Rank | Jan-May 2013 Enplaned Passengers | Pct. Change 2013-2014 |
|---|---|---|---|---|---|
| 1 | Miami | 2,421.7 | 1 | 2,379.4 | 1.8 |
| 2 | New York JFK | 1,902.5 | 2 | 1,862.0 | 2.2 |
| 3 | Atlanta | 1,837.6 | 3 | 1,695.1 | 8.4 |
| 4 | Newark | 1,569.7 | 4 | 1,598.9 | -1.8 |
| 5 | Houston Bush | 1,464.4 | 5 | 1,358.1 | 7.8 |
| 6 | Chicago O'Hare | 1,177.3 | 6 | 1,139.3 | 3.3 |
| 7 | Dallas/Fort Worth | 1,122.1 | 7 | 1,019.0 | 10.1 |
| 8 | Los Angeles | 905.1 | 8 | 777.4 | 16.4 |
| 9 | San Francisco | 759.1 | 9 | 707.6 | 7.3 |
| 10 | Philadelphia | 652.6 | 10 | 683.6 | -4.5 |
Source: Bureau of Transportation Statistics, T-100 International Market
Note: Percentage changes based on numbers prior to rounding.
Table 18. Top 10 U.S. Airports, ranked by May 2014 International Scheduled Enplanements on U.S. Airlines
Passenger numbers in thousands (000)
| May 2014 Rank | Airport | May 2014 Enplaned Passengers | May 2013 Rank | May 2013 Enplaned Passengers | Pct. Change 2013-2014 |
|---|---|---|---|---|---|
| 1 | Miami | 483.0 | 1 | 481.8 | 0.3 |
| 2 | New York JFK | 435.4 | 2 | 423.9 | 2.7 |
| 3 | Atlanta | 417.2 | 3 | 389.9 | 7.0 |
| 4 | Newark | 353.3 | 4 | 357.7 | -1.2 |
| 5 | Houston Bush | 312.0 | 5 | 281.6 | 10.8 |
| 6 | Chicago O'Hare | 292.1 | 6 | 271.1 | 7.7 |
| 7 | Dallas/Fort Worth | 247.3 | 7 | 227.1 | 8.9 |
| 8 | Los Angeles | 192.7 | 10 | 168.7 | 14.2 |
| 9 | San Francisco | 186.4 | 8 | 182.0 | 2.4 |
| 10 | Philadelphia | 173.9 | 9 | 170.7 | 1.9 |
Source: Bureau of Transportation Statistics, T-100 International Market
Note: Percentage changes based on numbers prior to rounding.