
May 2018 U.S. Airline Traffic Data
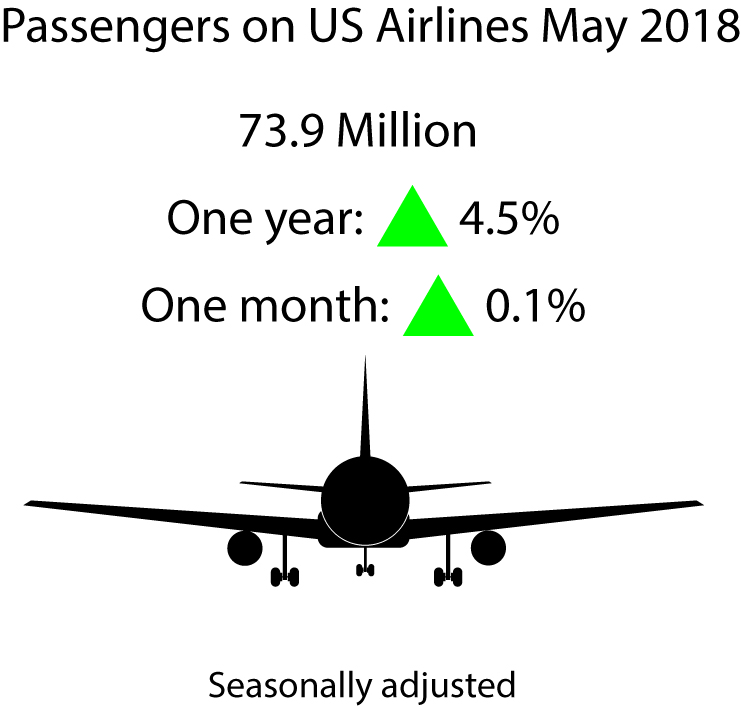
Figure 1. Seasonally-Adjusted Systemwide Passenger Enplanements on All U.S. Scheduled Airlines (Domestic & International), May 2015 - May 2018
| Enplanements in millions (Seasonally Adjusted) | |
|---|---|
| May-15 | 65.8 |
| Jun-15 | 66.1 |
| Jul-15 | 66.9 |
| Aug-15 | 67.4 |
| Sep-15 | 67.7 |
| Oct-15 | 68.0 |
| Nov-15 | 67.5 |
| Dec-15 | 67.9 |
| Jan-16 | 67.8 |
| Feb-16 | 67.7 |
| Mar-16 | 67.1 |
| Apr-16 | 67.9 |
| May-16 | 68.5 |
| Jun-16 | 68.8 |
| Jul-16 | 68.4 |
| Aug-16 | 67.9 |
| Sep-16 | 69.8 |
| Oct-16 | 69.3 |
| Nov-16 | 69.5 |
| Dec-16 | 69.6 |
| Jan-17 | 69.8 |
| Feb-17 | 69.6 |
| Mar-17 | 69.9 |
| Apr-17 | 70.3 |
| May-17 | 70.8 |
| Jun-17 | 70.8 |
| Jul-17 | 71.7 |
| Aug-17 | 71.2 |
| Sep-17 | 69.0 |
| Oct-17 | 72.1 |
| Nov-17 | 72.2 |
| Dec-17 | 72.3 |
| Jan-18 | 71.9 |
| Feb-18 | 73.0 |
| Mar-18 | 73.2 |
| Apr-18 | 73.9 |
| May-18 | 73.9 |
One Month: April to May 2018 domestic enplanements were virtually unchanged while enplanements on U.S. airlines’ international flights to and from the U.S. rose 0.4 percent for a 0.1 percent systemwide increase.
One Year: May 2017 to May 2018 domestic enplanements rose 4.9 percent while enplanements on U.S. airlines’ international flights to and from the U.S. rose 1.9 percent for a 4.5 percent systemwide increase.
Three Years: May 2015 to May 2018 domestic enplanements rose 12.7 percent while enplanements on U.S. airlines’ international flights to and from the U.S. rose 10.0 percent for a 12.4 percent systemwide increase.
Unadjusted: Systemwide, domestic and international enplanements all reached record highs for the month of May.
Additional Bureau of Transportation Statistics (BTS) air traffic data:
Seasonally-adjusted
New seasonally-adjusted all-time highs in May 2018
Passenger enplanements: Systemwide, international, and domestic passenger enplanements reached new seasonally-adjusted all-time highs.
Revenue passenger-miles: Systemwide and domestic revenue passenger miles (RPMs) reached new seasonally-adjusted all-time highs.
Available seat-miles: Systemwide, international, and domestic available seat-miles (ASMs) reached new seasonally-adjusted all-time highs.
Load Factor
Systemwide load factor (83.8 percent) was down 1.0 points from the all-time seasonally-adjusted high (84.8 percent) reached in October 2015. Domestic and international load factors both declined.
Load factor is a measure of the use of aircraft capacity that compares the system use, measured in RPMs as a proportion of system capacity, measured in ASMs.
The load factor was unchanged from April to May 2018 as the percentage rise in RPMs and ASMs was virtually the same.
Seasonally-adjusted trends are for the time period January 2000 to present. Additional data, including domestic and international numbers, can be found on the seasonally-adjusted data page.
Unadjusted Trends
Figure 2. Unadjusted Systemwide Passenger Enplanements on All U.S. Scheduled Airlines (Domestic & International), May 2015 - May 2018
| Enplanements in millions (Unadjusted) | |
|---|---|
| May-15 | 68.9 |
| Jun-15 | 71.3 |
| Jul-15 | 75.6 |
| Aug-15 | 72.9 |
| Sep-15 | 63.7 |
| Oct-15 | 68.7 |
| Nov-15 | 64.6 |
| Dec-15 | 66.4 |
| Jan-16 | 60.8 |
| Feb-16 | 58.5 |
| Mar-16 | 70.6 |
| Apr-16 | 67.2 |
| May-16 | 71.5 |
| Jun-16 | 74.5 |
| Jul-16 | 76.9 |
| Aug-16 | 73.5 |
| Sep-16 | 66.5 |
| Oct-16 | 69.5 |
| Nov-16 | 66.6 |
| Dec-16 | 68.0 |
| Jan-17 | 62.6 |
| Feb-17 | 58.4 |
| Mar-17 | 73.0 |
| Apr-17 | 70.3 |
| May-17 | 73.7 |
| Jun-17 | 77.0 |
| Jul-17 | 79.8 |
| Aug-17 | 77.1 |
| Sep-17 | 64.9 |
| Oct-17 | 72.7 |
| Nov-17 | 69.6 |
| Dec-17 | 70.3 |
| Jan-18 | 64.4 |
| Feb-18 | 61.7 |
| Mar-18 | 76.3 |
| Apr-18 | 73.6 |
| May-18 | 77.4 |
New May unadjusted all-time highs
Passenger enplanements: Systemwide, international, and domestic passenger enplanements all reached new highs for the month of May.
One month: April to May 2018: domestic enplanements rose 5.2 percent and enplanements on U.S. airlines’ international flights to and from the U.S. rose 4.2 percent for a 5.1 percent systemwide increase.
One year: May 2017 to May 2018, domestic enplanements rose 5.4 percent while international enplanements rose 2.3 percent for a 5.0 percent systemwide increase.
Three years: May 2015 to May 2018, domestic enplanements rose 12.7 percent while international enplanements rose 8.9 percent for and 12.3 percent systemwide increase.
Revenue passenger-miles: Systemwide, international and domestic revenue passenger miles (RPMs) all reached new highs for the month of May.
Available seat-miles: Systemwide, international, and domestic available seat-miles (ASMs) all reached new highs for the month of May.
Load Factor:
Systemwide load factor (84.1) was down 0.9 points from the all-time May high (85.0) reached in 2014 based on unrounded numbers. Domestic load factor (85.2) was down 1.0 points from the all-time May high (86.3) reached in 2014. International load factor (81.4) was down 1.4 points from the all-time May high (82.8) reached in 2013.
Unadjusted load factor rose from May 2017 (84.0 percent) to May 2018 (84.1 percent) because passenger travel grew faster (6.6 percent increase in RPMs) than system capacity grew (5.2 percent increase in ASMs).
Unadjusted trends are for the time period January 1996 to present. Data are available at Customize Table and can be downloaded from the seasonally-adjusted data page.
Explanation of seasonal adjustment
When the primary purpose is to examine monthly shifts in transportation services output and analyze short-term trends, the variation introduced by normal seasonal changes must be removed from the data. Transportation is highly seasonal, and without adjustment, the data do not give an accurate picture of underlying changes in aviation, passenger travel.
Seasonal adjustment of the data removes the seasonal events that follow a regular seasonal pattern. Changes that are not due to seasonality, such as a change in air travel resulting from economic conditions become more readily apparent.
The aviation data are seasonally adjusted for the effects of trading day, moving holidays, and data outliers.
See Seasonal Adjustment for methodology and additional explanation.
Reporting Notes
Data are compiled from monthly reports filed with BTS by commercial U.S. air carriers detailing operations, passenger traffic and freight traffic. This release includes data received by BTS from 78 U.S. carriers as of Aug.7 for U.S. carrier scheduled civilian operations.
For additional scheduled service numbers for U.S. and foreign airlines, by airline and by airport, see Passengers, Flights, Revenue Passenger-Miles, Available Seat-Miles and Load Factor. To create a customized table for passengers, flights, RPMs, ASMs and other data, including non-scheduled service, go to https://www.transtats.bts.gov/TRAFFIC/
BTS has scheduled Sept. 14 for the release of June traffic data. None of the data are from samples so measures of statistical significance do not apply.