
Mid-January 2021 U.S. Passenger Airline Employment Up Nearly 19,000 FTEs from Mid-December
Release Number: BTS 20-21
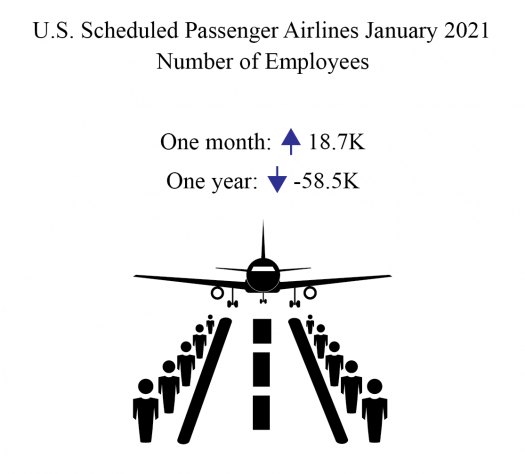
The 22 U.S. scheduled passenger airlines employed 4.9% more full-time equivalents (FTEs) in mid-January 2021 than in mid-December 2020:
- Mid-January’s total number of FTEs (397,999) was up 18,697 from mid-December 2020 (379,302) and down 62,034 from mid-March 2020 (460,033). January 2021 was the lowest FTE total for the month of January since 2015 (386,528).
- Mid-January FTEs were down 58,535, a 12.8% drop from mid-January 2020 (456,534).
In mid-January, scheduled passenger airlines employed 61% of the total airline industry FTEs, down from 66% in March 2020. Total industry FTEs, released on March 9, rose 18,073 FTEs (2.8%) from mid-December to mid-January. Total industry includes cargo and charter.
Regulations require U.S. airlines to report employment numbers for employees who worked or received pay for any part of the pay period(s) ending nearest the 15th day of the month. U.S. airline employment reports are filed monthly with the Bureau of Transportation Statistics. See the tables that accompany this release on the BTS website for detailed data since 2015 (Tables 1-15) and industry summary monthly data since 1990.
United Airlines added 13,600 FTEs from December to January. Piedmont Airlines, a regional carrier, reported monthly employment numbers for the first time with the January data. Piedmont reported 6,500 FTEs in January.
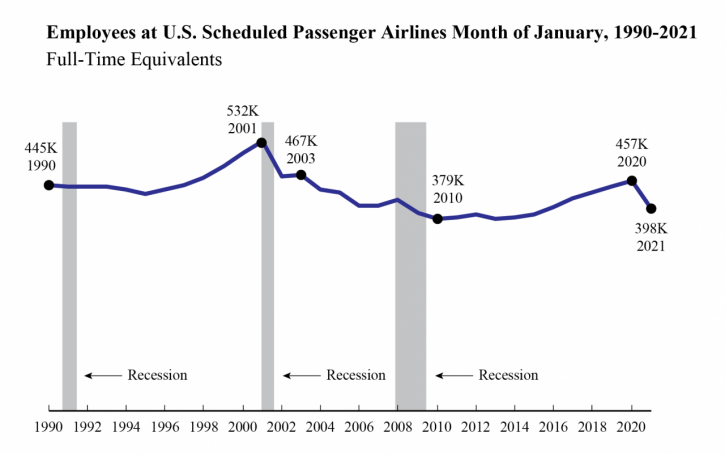
Employees at U.S. Scheduled Passenger Airlines Month of January, 1990-2021
| January FTEs in thousands (000) | |
|---|---|
| 1990 | 444.9 |
| 1991 | 442.6 |
| 1992 | 441.1 |
| 1993 | 441.0 |
| 1994 | 437.5 |
| 1995 | 427.2 |
| 1996 | 435.9 |
| 1997 | 445.7 |
| 1998 | 459.3 |
| 1999 | 482.2 |
| 2000 | 508.5 |
| 2001 | 532.1 |
| 2002 | 464.0 |
| 2003 | 466.9 |
| 2004 | 436.1 |
| 2005 | 430.8 |
| 2006 | 405.2 |
| 2007 | 403.7 |
| 2008 | 415.1 |
| 2009 | 390.6 |
| 2010 | 379.3 |
| 2011 | 381.2 |
| 2012 | 386.4 |
| 2013 | 380.0 |
| 2014 | 381.8 |
| 2015 | 386.5 |
| 2016 | 402.3 |
| 2017 | 417.8 |
| 2018 | 429.8 |
| 2019 | 443.4 |
| 2020 | 456.5 |
| 2021 | 398.0 |
FTE calculations count two part-time employees as one full-time employee.
Bureau of Transportation Statistics
All 18 scheduled service passenger airlines (mid-January)
- 397,999 FTEs
- Down 12.8% (58,535 FTEs) from January 2020 (456,534 FTEs)
- Down 4.7% (19,834 FTEs) from December 2017 (417,833 FTEs)
Four network airlines (mid-January)
- 241,546 FTEs, 60.7% of total scheduled passenger airline FTEs
- Down 16.8% (48,795 FTEs) from January 2020 (290,341 FTEs)
- Down 11.3% (30,861 FTEs) from January 2017 (272,407 FTEs)
- Up 5.5% (12,697 FTEs) from mid-December 2020 (228,849 FTEs)
- Down 17.1% (49,663 FTEs) from mid-March 2020 (291,209 FTEs)
Network airlines operate a significant portion of their flights using at least one hub where connections are made for flights to down-line destinations or spoke cities. Note that beginning with January 2018 data, Virgin America’s numbers are included with Alaska Airlines in the network category.
Five low-cost airlines (mid-January)
- 91,174 FTEs, 22.9% of total scheduled passenger airline FTEs
- Down 7.0% (6,866 FTEs) from January 2020 (98,040 FTEs)
- Up 5.7% (4,887 FTEs) from January 2017 (86,287 FTEs)
- Down 0.5% (489 FTEs) from mid-December 2020 (91,663 FTEs)
- Down 7.5% (7,357 FTEs) from mid-March 2020 (98,531 FTEs)
Low-cost airlines operate under a low-cost business model, with infrastructure and aircraft operating costs below the overall industry average.
Nine regional airlines (mid-January)
- 57,834 FTEs, 14.5% of total scheduled passenger airline FTEs
- Down 1.7% (1,026 FTEs) from January 2020 (58,860 FTEs)
- Up 12.5% (6,404 FTEs) from January 2017 (51,430 FTEs)
- Up 12.8% (6,566 FTEs) from mid-December 2020 (51,268 FTEs)
- Down 5.2% (3,169 FTEs) from mid-March 2020 (61,003 FTEs)
Regional carriers typically provide service from small cities, using primarily regional jets to support the network carriers’ hub and spoke systems.
Top Employers by Group
- Network: American 94,168 FTEs
- Low-Cost: Southwest 56,398 FTEs
- Regional: SkyWest 16,962 FTEs
Four other airlines
Other carriers generally operate within specific niche markets. They are: Hawaiian Airlines, Sun Country Airlines, Silver Airlines and Eastern Airlines.
Reporting Notes
Airlines that operate at least one aircraft that has more than 60 seats or the capacity to carry a payload of passengers, cargo and fuel weighing more than 18,000 pounds must report monthly employment statistics.
Data are compiled from monthly reports filed with BTS by commercial air carriers as of March 9. Additional airline employment data and previous releases can be found on the BTS website. BTS has scheduled release of February passenger airline employment data for April 19.