
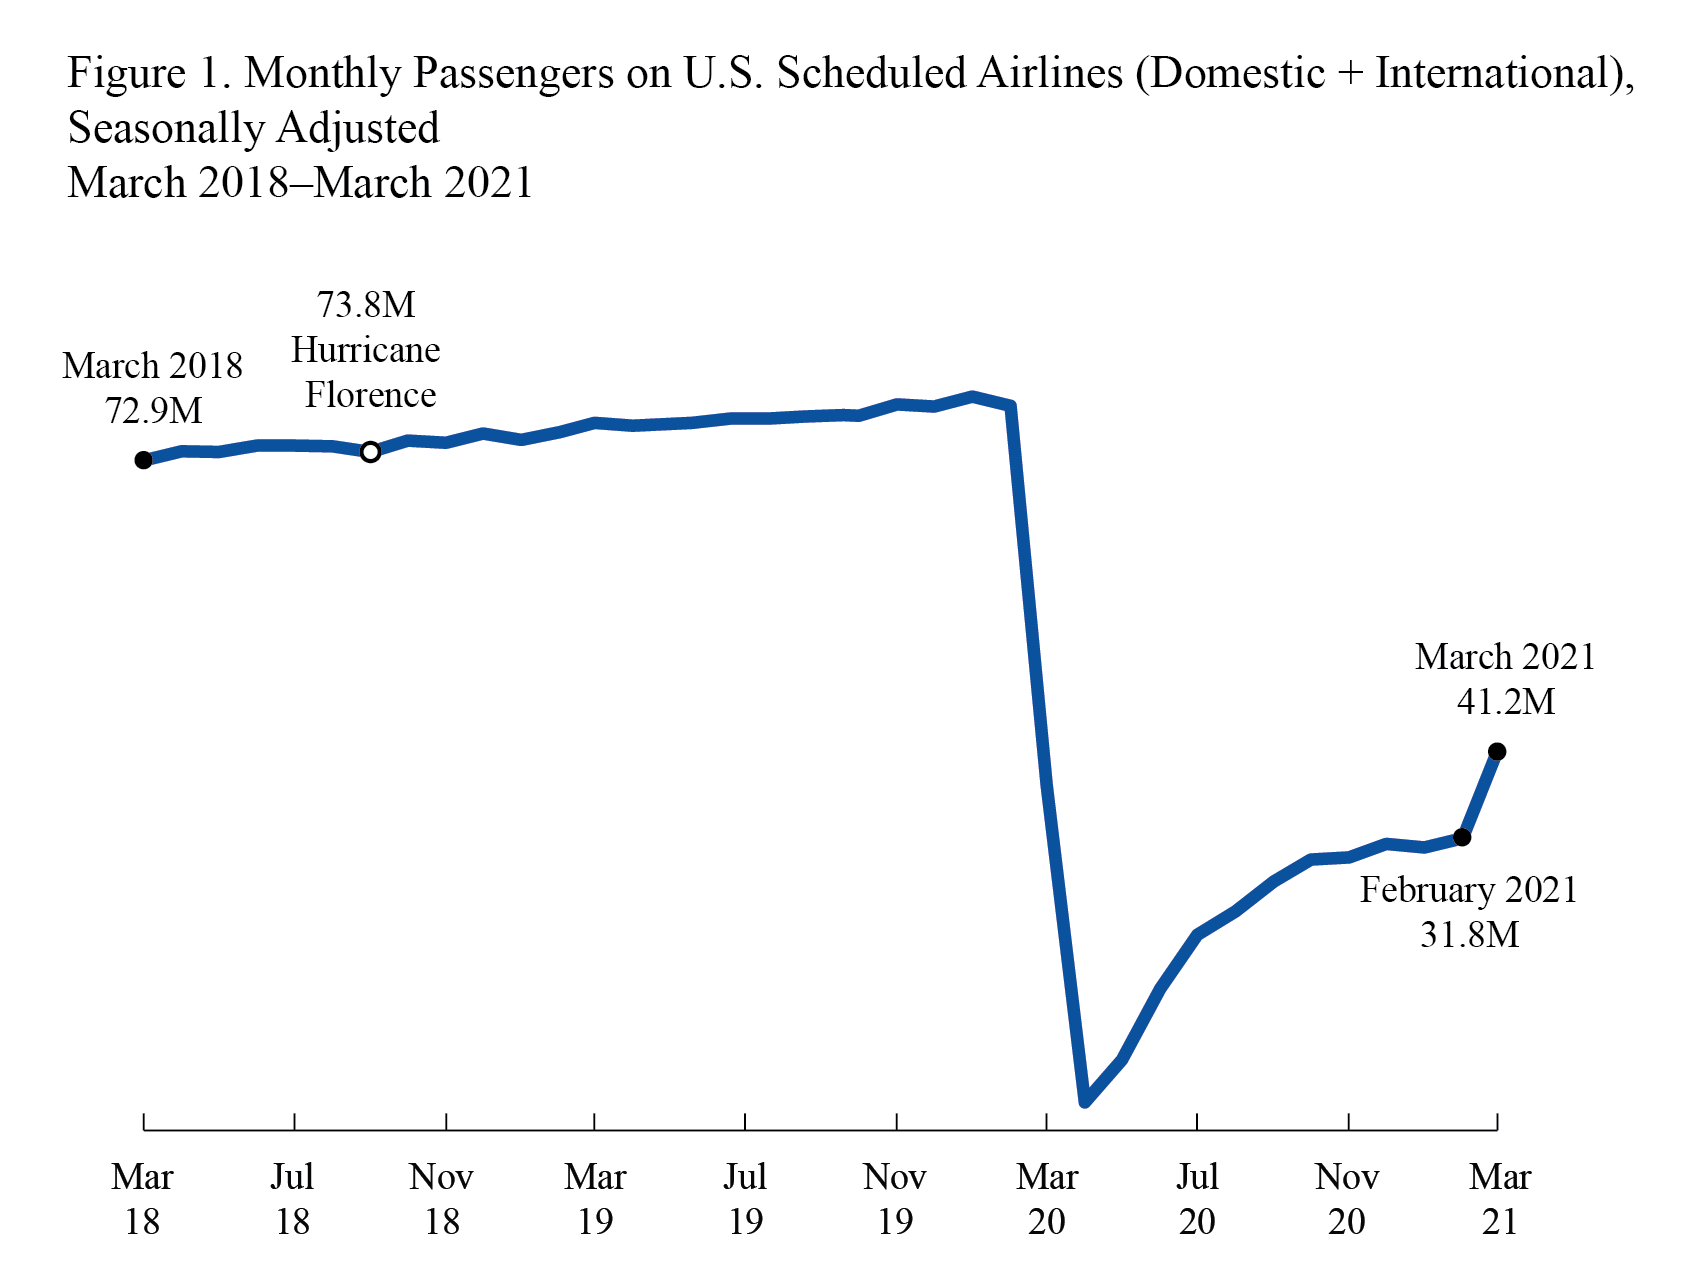
Monthly Passengers on U.S. Scheduled Airlines (Domestic + International), Seasonally Adjusted January 2018 - March 2021
Figure
Dataset Table:
| 2018 | 2019 | 2020 | 2021 | |
|---|---|---|---|---|
| January | 72.53 | 75.11 | 79.77 | 30.75 |
| February | 73.79 | 75.97 | 78.79 | 31.78 |
| March | 72.89 | 76.91 | 37.56 | 41.18 |
| April | 73.87 | 76.64 | 3.00 | |
| May | 73.75 | 76.96 | 7.66 | |
| June | 74.47 | 77.37 | 15.35 | |
| July | 74.47 | 77.40 | 21.23 | |
| August | 74.37 | 77.62 | 23.82 | |
| September | 73.81 | 77.76 | 27.05 | |
| October | 75.02 | 77.69 | 29.45 | |
| November | 74.80 | 78.92 | 29.70 | |
| December | 75.77 | 78.75 | 31.11 |
Notes:
Systemwide (Domestic + International) passenger enplanements (seasonally-adjusted) in millions (000,000)
Scheduled service only
Source:
Bureau of Transportation Statistics, T-100 Market