
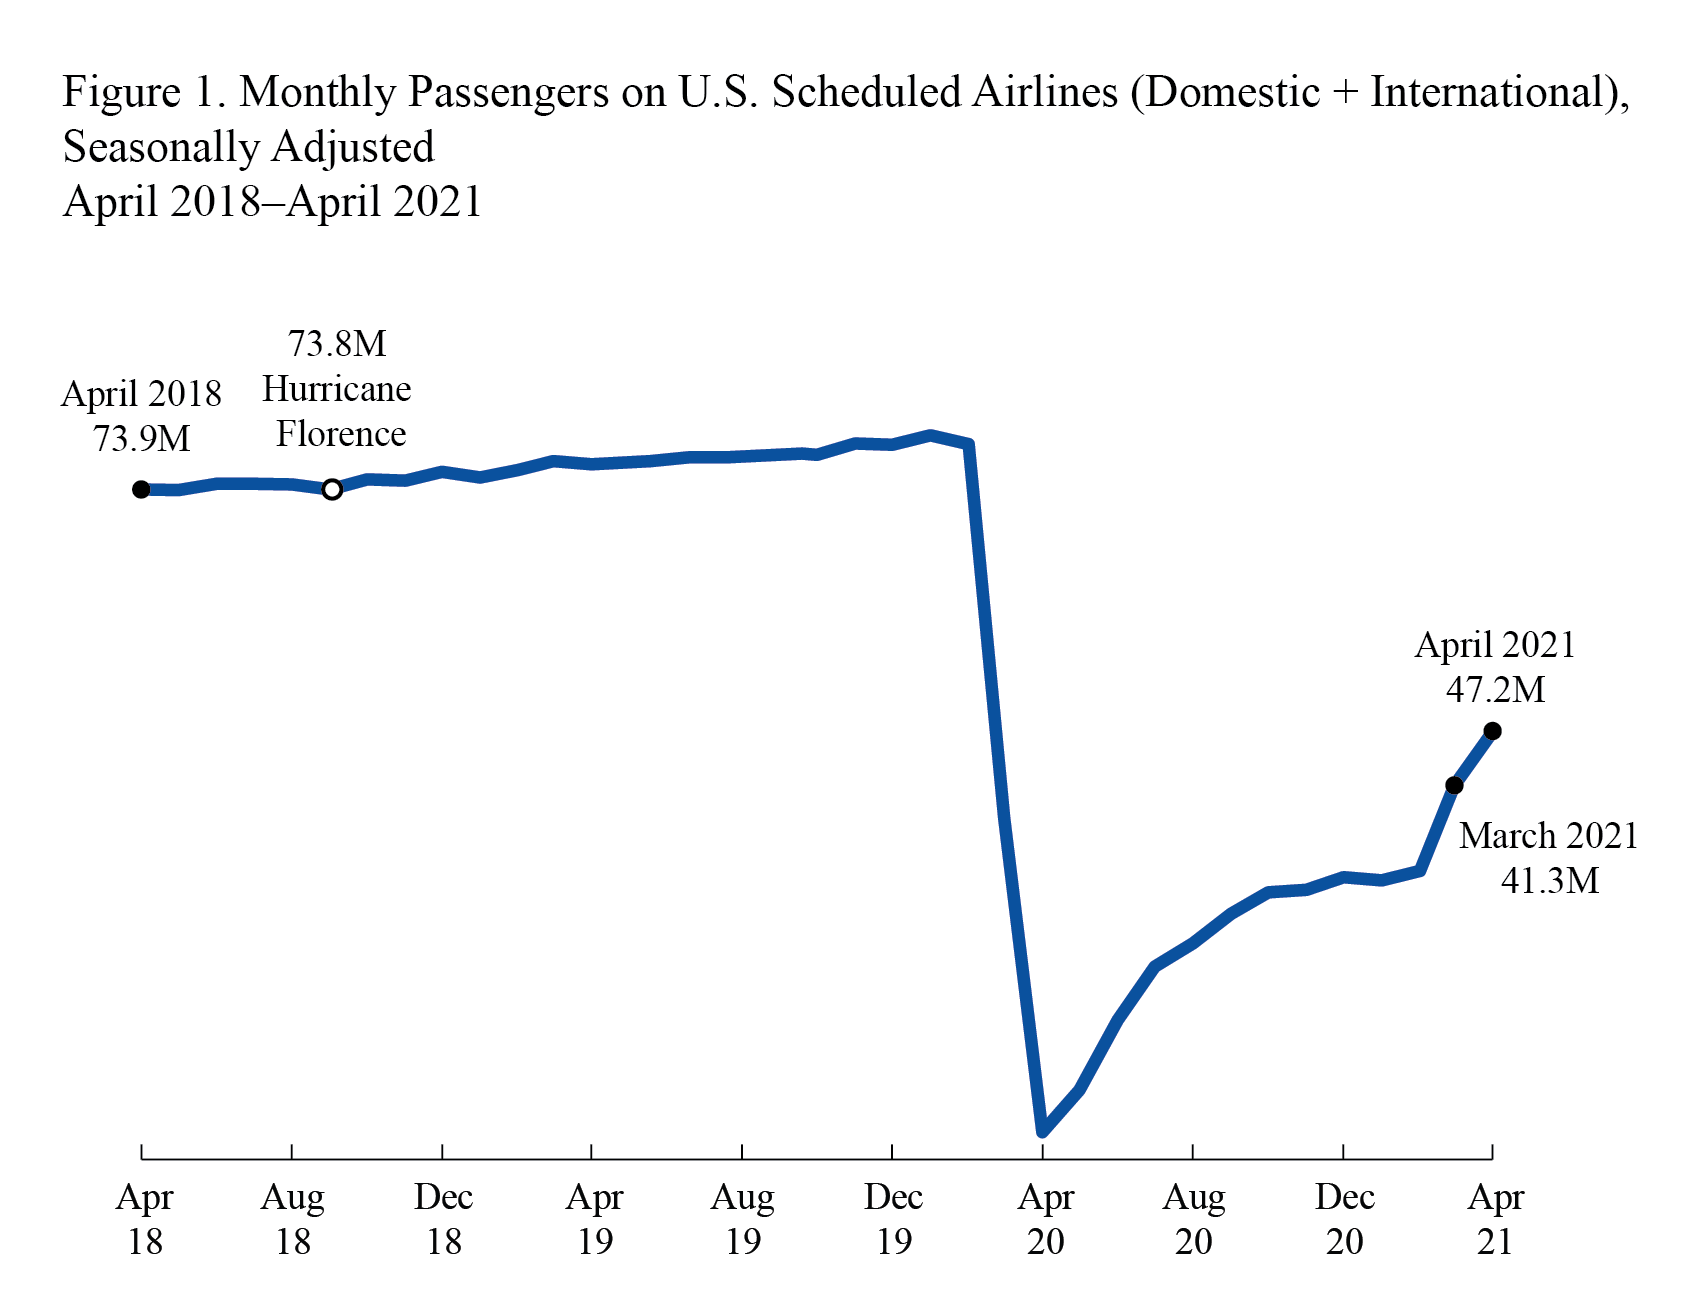
Monthly Passengers on U.S. Scheduled Airlines (Domestic + International), Seasonally Adjusted January 2018 - April 2021
Figure
Dataset Table:
| 2018 | 2019 | 2020 | 2021 | ||
| January | 72.53 | 75.13 | 79.79 | 30.76 | |
| February | 73.79 | 75.98 | 78.80 | 31.79 | |
| March | 72.92 | 76.98 | 37.62 | 41.25 | |
| April | 73.85 | 76.59 | 2.99 | 47.16 | |
| May | 73.76 | 76.96 | 7.66 | ||
| June | 74.47 | 77.38 | 15.35 | ||
| July | 74.47 | 77.40 | 21.23 | ||
| August | 74.37 | 77.61 | 23.82 | ||
| September | 73.83 | 77.78 | 27.06 | ||
| October | 74.97 | 77.62 | 29.42 | ||
| November | 74.80 | 78.91 | 29.69 | ||
| December | 75.77 | 78.75 | 31.11 | ||
Notes:
Domestic + International, seasonally-adjusted, in millions, scheduled service only.
Description:
Systemwide Passenger Enplanements on U.S. Airlines, Seasonally-Adjusted
Source:
Bureau of Transportation Statistics, T-100 Market