
National Transportation Atlas Database Summer 2019 Update
Friday, July 19, 2019 - The Summer 2019 update to the National Transportation Atlas Database (NTAD) was released today with one new dataset and 11 updated datasets.
NTAD is a Bureau of Transportation Statistics (BTS) compilation of geospatial datasets representing the nation’s transportation infrastructure, containing roadways, railways, waterways, and airports.
The new dataset in this version is roll-on/roll-off (ro-ro) port intermodal freight facilities. The ro-ro facilities layer is the third in a series of datasets to be released as part of the Intermodal Freight Facility database.
Additional updates in this release include:
- Congressional Districts with revised geographies;
- Alternative Fueling Stations;
- Rail data including:
- Amtrak Routes
- Amtrak Stations
- Grade Crossings;
- National Bridge Inventory (NBI) from 2018;
- Military Bases;
- Waterway data including:
- Waterway Network
- Waterway Network Nodes
- Ports;
- National Parks
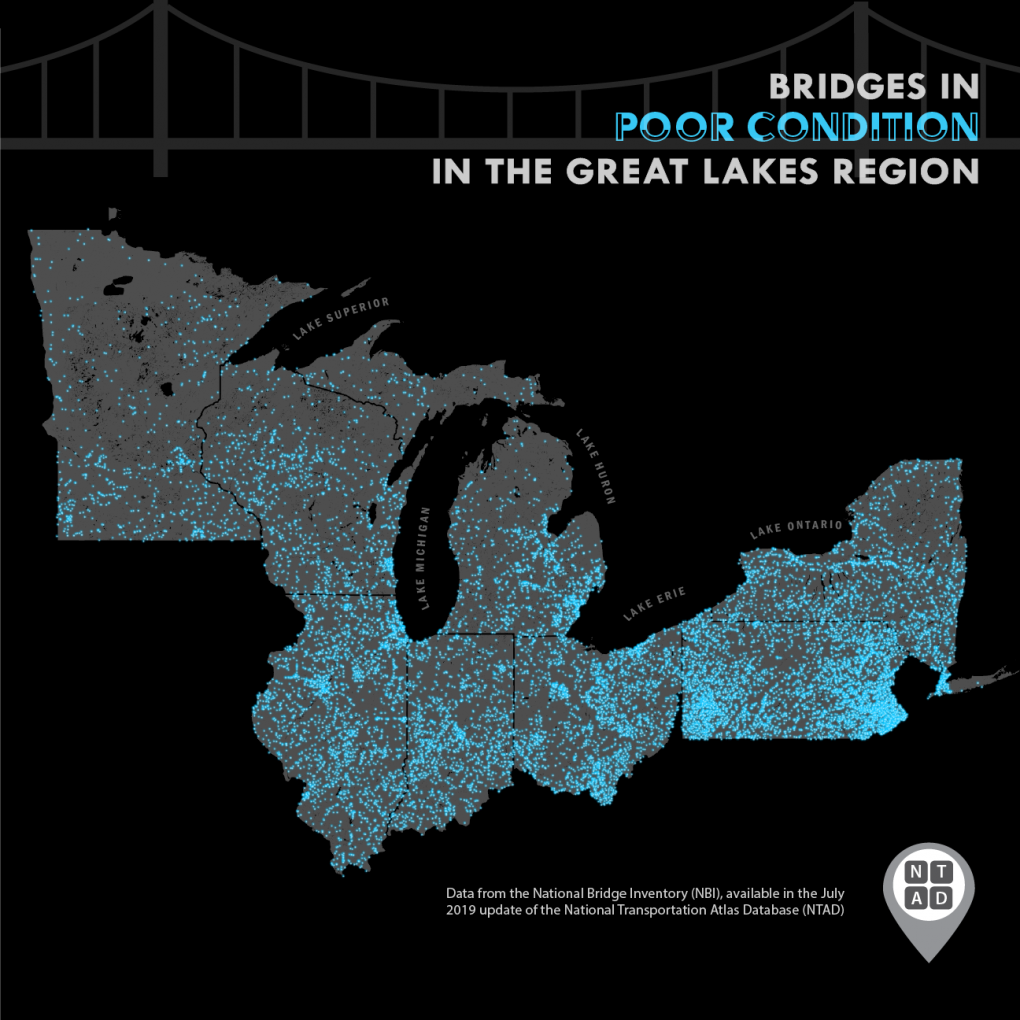
In 2018, there were 616,096 total highway bridges in the U.S., of which 47,054, or 7.6%, were in Poor condition. In the Great Lakes Region depicted in the graphic, there were 152,485 total highway bridges, of which 13,439, or 8.8%, were in Poor condition.
Compared to the 7.6% of all highway bridges by count in Poor condition, 3.3% of bridges by count on the National Highway System (NHS) were in Poor condition. Bridges are classified as Poor based on the percent of deck area classified as good and poor, using NBI condition ratings for Deck, Superstructure, Substructure, and Culvert.
NTAD is available for download in comma separated values (CSV), Keyhole Markup Language (KML), and shapefile formats through the BTS Geospatial Data Catalog. Additionally, Open Geospatial Consortium (OGC) standard Web Feature Services (WFS) (including Web Mapping Services (WMS)) are available for all NTAD datasets. Also available are optimized services that allow for faster rendering of full NTAD datasets, and vector tile services for 13 of the largest NTAD datasets. These full NTAD datasets and their respective faster services are designated by service names ending in “DS” for each layer, and the vector tiles service names ending in “VT”.
BTS now uses a dynamic NTAD publication cycle, making updated data available throughout the year when they become available from their respective government agencies. Follow @TransportStats on Twitter for announcements of additional dataset releases throughout the year. Contacts: Press: Dave Smallen: (202) 366-5568. For technical information and questions: Dominic Menegus: (202) 366-8717.