
North American Trade Numbers by Mode of Transportation for January
Trucks carried 59.3 percent of the $90.5 billion in trade in January 2013 between the United States and its North American Free Trade Agreement (NAFTA) partners, Canada and Mexico, followed by rail at 14.3 percent, vessels at 9.8 percent, pipelines at 8.1 percent and air at 3.8 percent, according to the Bureau of Transportation Statistics (BTS) of the U.S. Department of Transportation (Table 2). The surface transportation modes of truck, rail and pipeline carried 81.7 percent of the total NAFTA trade.
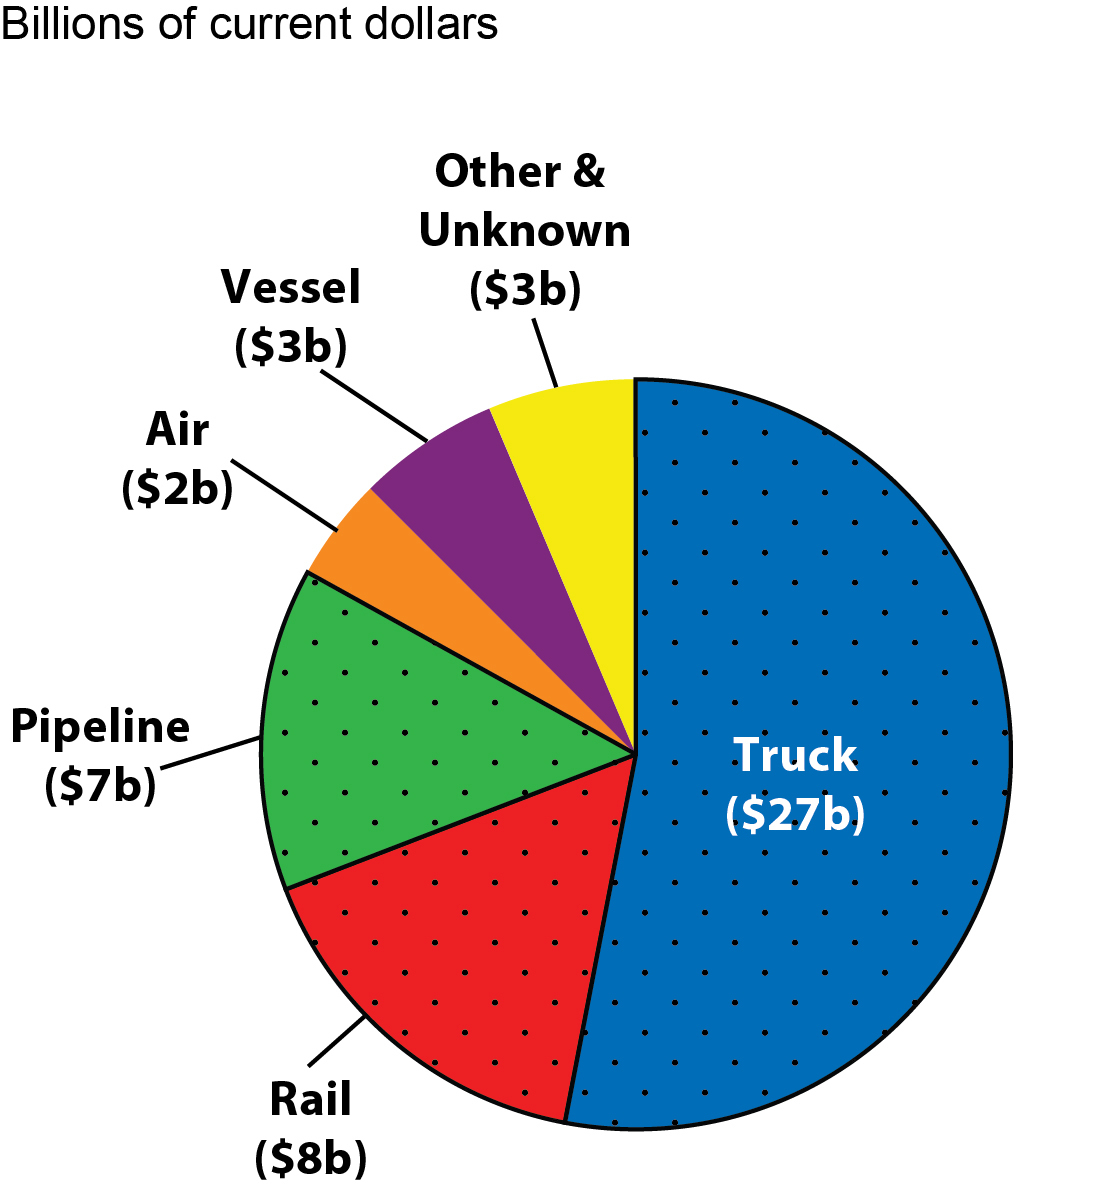
BTS, a part of the Department’s Research and Innovative Technology Administration, reported that in January 2013, for trade between the United States and Canada, trucks carried 53.1 percent of the $51.0 billion in trade, followed by rail at 16.2 percent, pipelines at 13.9 percent and vessels at 6.1 percent and air at 4.4 percent (Figure 3A and Table 4). The surface transportation modes of truck, rail and pipeline carried 83.1 percent of the total U.S.-Canada trade.
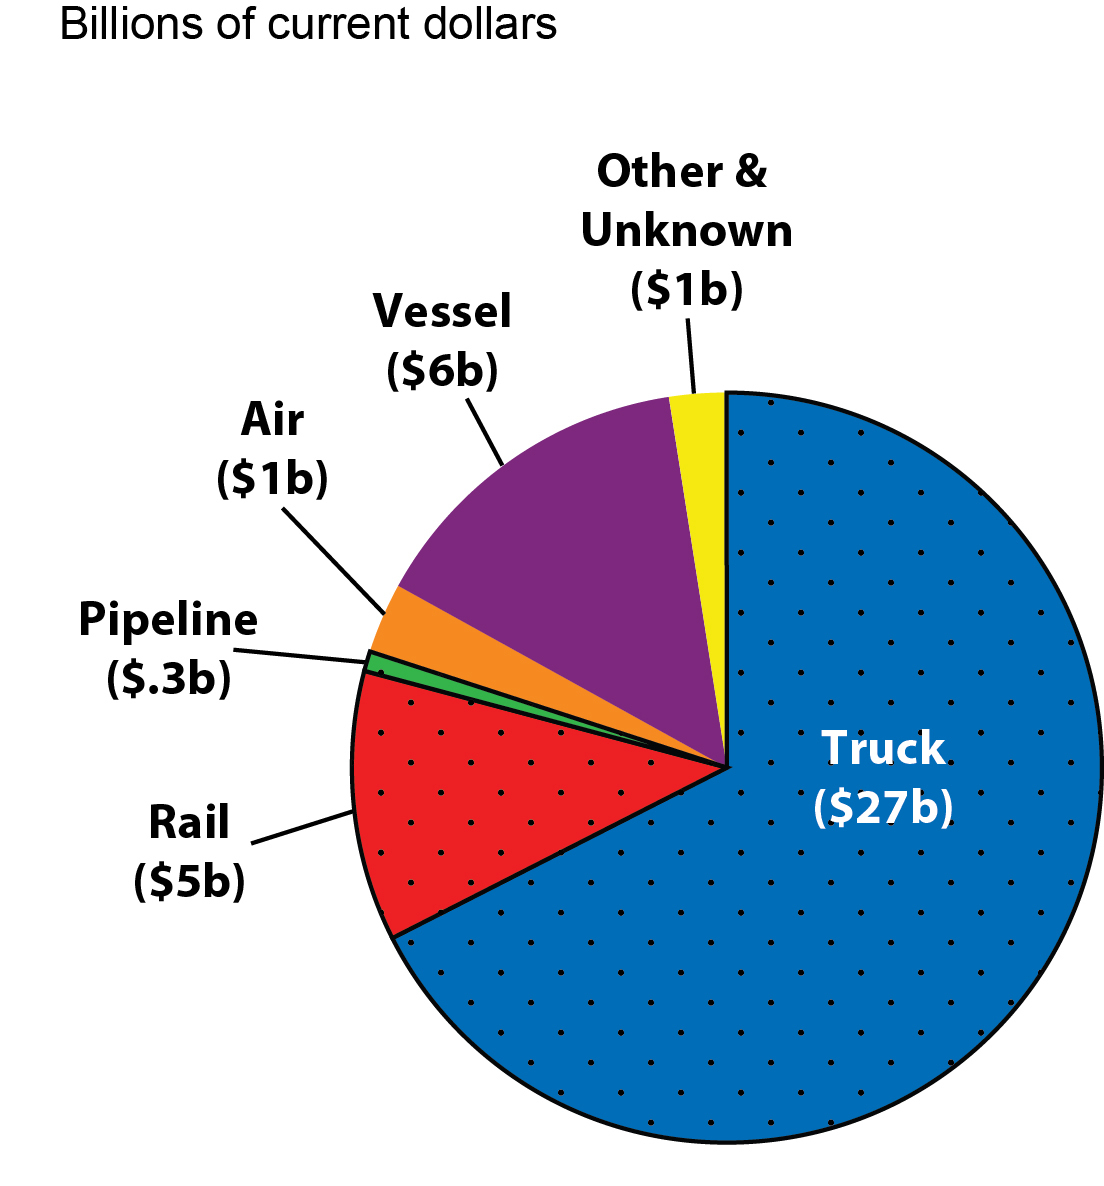
In U.S. trade with Mexico in January 2013, trucks carried 67.4 percent of the $39.5 billion in trade, followed by vessels at 14.5 percent, rail at 11.8 percent, air at 3.1 percent and pipelines at 0.7 percent (Figure 3B and Table 7). The surface transportation modes of truck, rail and pipeline carried 79.9 percent of the total U.S.-Mexico trade.
BTS monthly TransBorder press releases, beginning with January 2013 data, now contain data for air and vessel. Previous press releases defined surface modes as: truck, rail, pipeline, other and unknown modes. Beginning with this press release, “other and unknown” modes are not being grouped with surface transportation. Data on surface modes can be found in Figure 3 and in Tables 2, 4 and 7. See North American Transborder Freight Data on the BTS website for additional data for surface modes since 1995 and all modes since 2004.
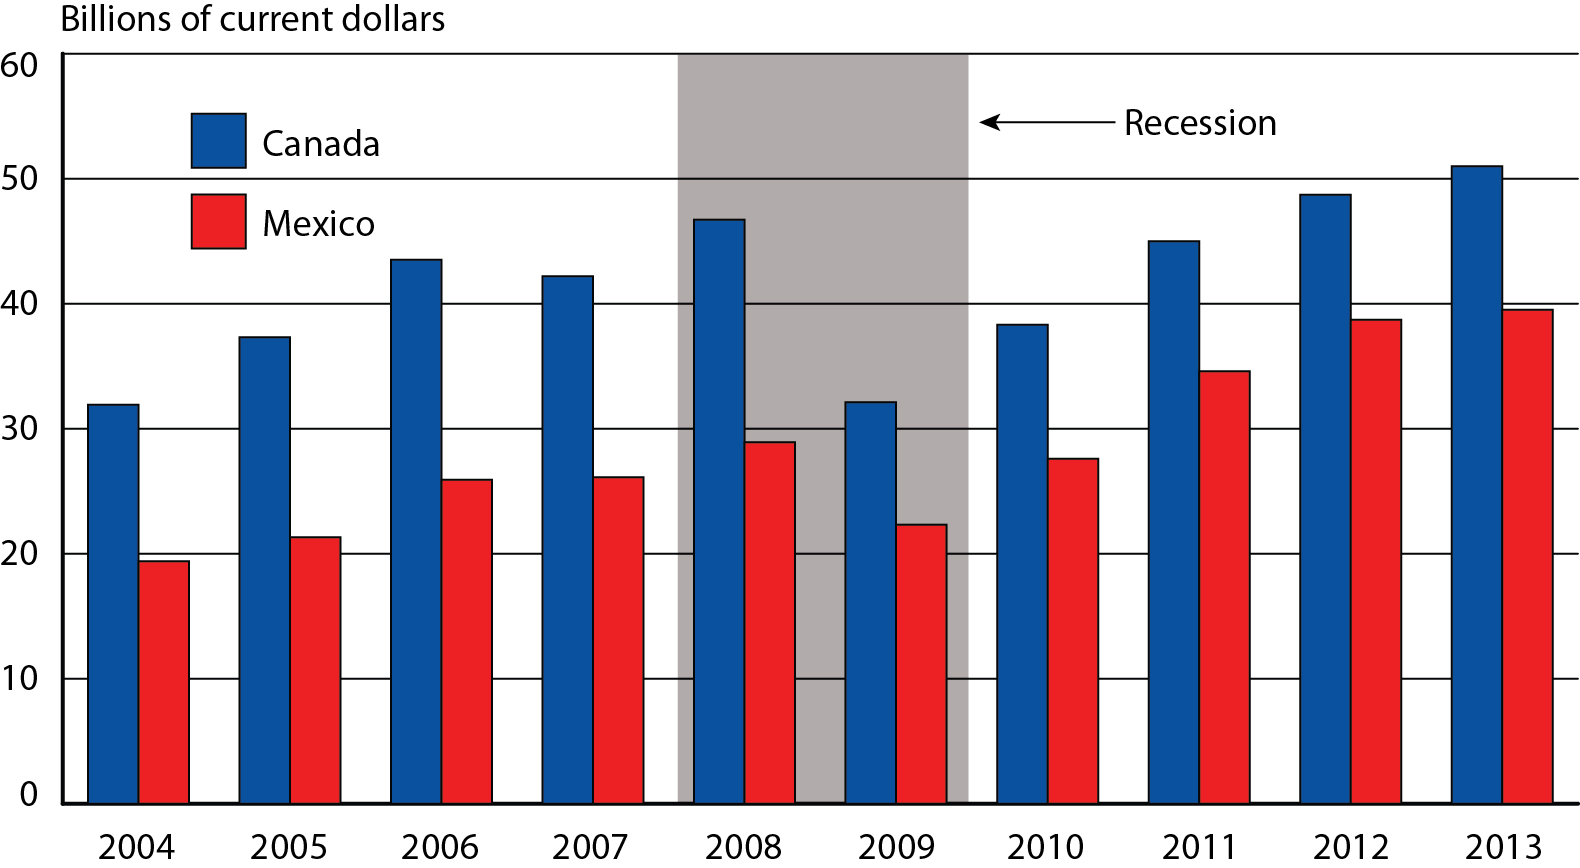
Figure 1: U.S. Trade with NAFTA Partners by All Modes of Transportation,
January 2004 - January 2013
| Year | Canada | Mexico |
|---|---|---|
| 2004 | 31.9 | 19.4 |
| 2005 | 37.3 | 21.3 |
| 2006 | 43.5 | 25.9 |
| 2007 | 42.2 | 26.1 |
| 2008 | 46.7 | 28.9 |
| 2009 | 32.1 | 22.3 |
| 2010 | 38.3 | 27.6 |
| 2011 | 45.0 | 34.6 |
| 2012 | 48.7 | 38.7 |
| 2013 | 51.0 | 39.5 |
SOURCE: Bureau of Transportation Statistics, TransBorder Freight Data
Figure 2: Trade Between the U.S. and NAFTA Partners,
January 2004- January 2013
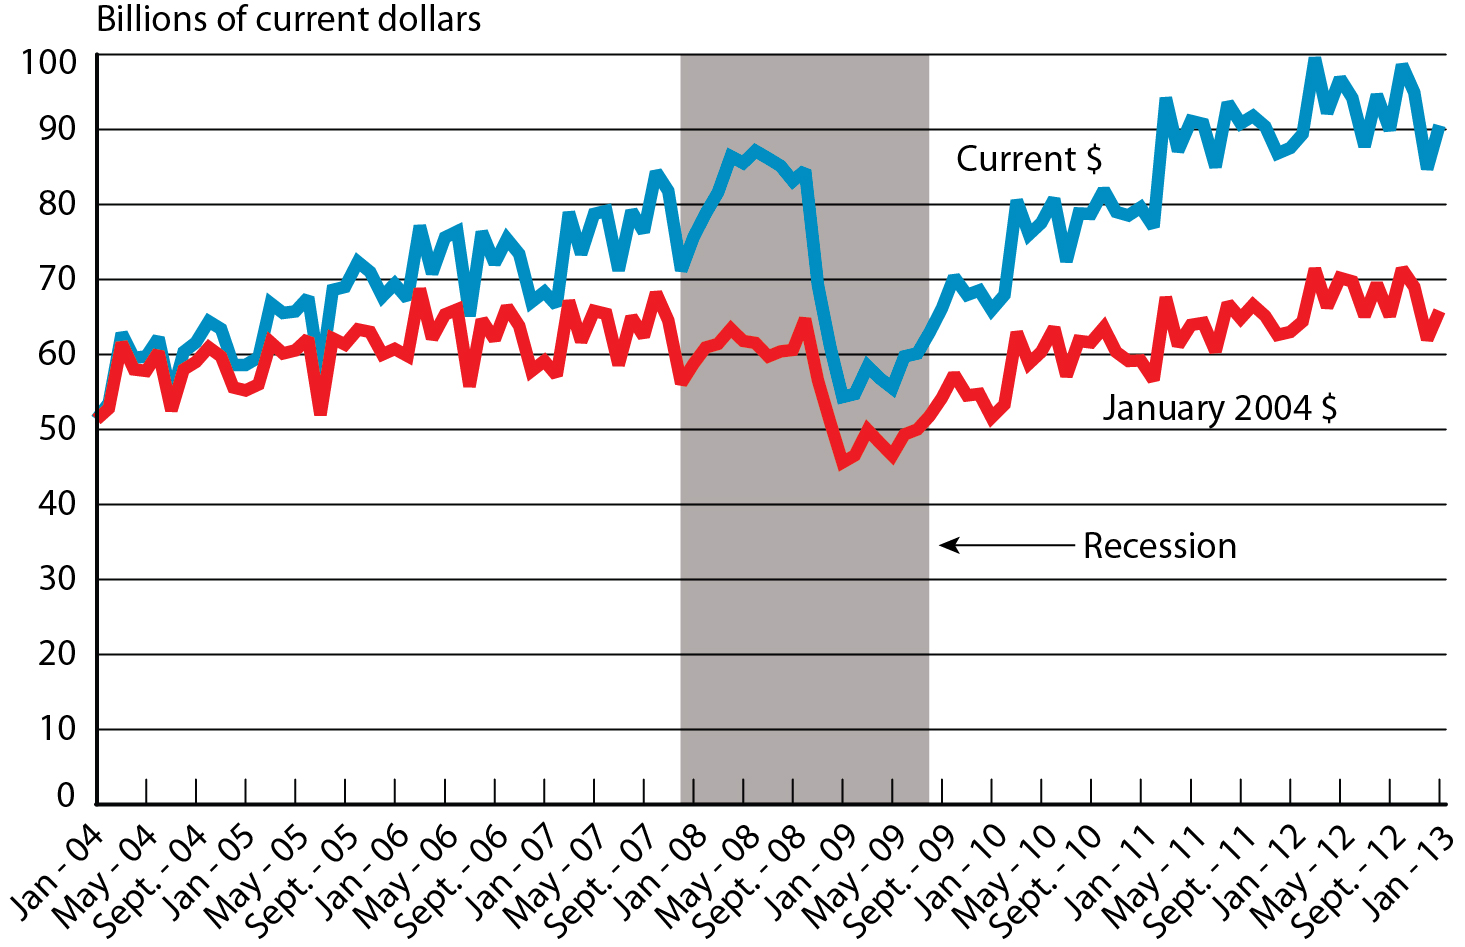
SOURCE: Bureau of Transportation Statistics, TransBorder Freight Data
The value of U.S. trade with its NAFTA partners by all modes of transportation in January rose 66.6 percent from January 2009, during the last recession (Table 3). Data in this press release are not adjusted for inflation, except for the monthly totals illustrated in Figure 2 for comparison.
From January 2004, the first month that TransBorder freight data included air and vessel modes, the value of U.S. trade by all modes of transportation with its NAFTA partners increased by 76.5 percent to January 2013. Imports in January 2013 were up 66.5 percent since January 2004, while exports were up 90.3 percent (Figure 2 and Table 3).
All modes of transportation include freight movements by truck, rail, vessel, pipeline, air, other and unknown modes of transport. Figures 3a and 3b below provide a breakdown by value and percentage of each mode of freight transportation used in trade with Canada and Mexico for January. The shaded slices represent surface modes, which accounted for 83.2 percent of total trade with Canada and 79.9 percent of total trade with Mexico. By value, truck is the most heavily utilized mode for trade with both U.S.-NAFTA partners, accounting for $25.7 billion of imports and $28.0 billion of exports.
| Mode | Total Trade Value | Percent |
|---|---|---|
| All Modes | 51,012,624,851 | 100.0 |
| Truck | 27,067,562,340 | 53.1 |
| Rail | 8,246,998,504 | 16.2 |
| Pipeline | 7,077,733,231 | 13.9 |
| Air | 2,245,975,386 | 4.4 |
| Vessel | 3,100,031,196 | 6.1 |
| Other & Unknown | 3,274,324,194 | 6.4 |
| Mode | Total Trade Value | Percent |
|---|---|---|
| All Modes | 39,499,343,687 | 100.0 |
| Truck | 26,630,373,784 | 67.4 |
| Rail | 4,656,538,240 | 11.8 |
| Pipeline | 285,702,506 | 0.7 |
| Air | 1,206,547,228 | 3.1 |
| Vessel | 5,729,566,009 | 14.5 |
| Other & Unknown | 990,615,920 | 2.5 |
SOURCE: Bureau of Transportation Statistics, TransBorder Freight Data
The value of U.S. trade by all modes of transportation with its NAFTA partners increased 6.9 percent in January 2013 from December 2012 (Table 2). Freight flows moving across the border by truck increased by 11.8 percent, while freight moving by rail decreased by 5.8 percent from one month prior. Month-to-month changes can be affected by seasonal factors such as the number of days in each month.
From January 2012 to January 2013, the value of freight carried by truck rose by 3.0 percent while the value of freight carried by rail increased 4.8 percent. For trade statistics by mode and individual NAFTA partner, see Table 4 for Canada and Table 7 for Mexico.
In January, Michigan led all states in trade with Canada, at $5.7 billion (Table 5). In addition, New York had the largest year-to-year percentage increase among the top 10 states, at 12.0 percent. The top commodity category transported between the U.S. and Canada by pipeline in January was mineral fuels, valued at $7.1 billion (Table 6).
Texas continued to lead all states in trade with Mexico by all modes of transportation at $15.9 billion (Table 8). In addition, Ohio had the largest year-to-year percentage increase among the top 10 states, at 19.1 percent. The top commodity category transported between the U.S. and Mexico by truck in January was electrical machinery with $6.9 billion in trade (Table 9).
Additional data adjusted for inflation and exchange rates can be found at the BTS website under TransBorder Indexed Freight Flow Data. The BLS indexes used in the adjustments for inflation and exchange rates may be revised in each of the three months after original publication. For example, index values released in January 2012 were subject to revision in February, March and April of that year.
For more information, see TransBorder Press Releases for previous press releases and summary tables. See TransBorder Freight Data for data from previous months, and individual state data. BTS has scheduled the release of February 2013 TransBorder numbers for May 1.
Table 1. Value of Monthly U.S. Trade with NAFTA Partners
(millions of current dollars)
| Month | 2011 | 2012 | 2013 | Percent Change 2011-2012 | Percent Change 2012-2013 |
|---|---|---|---|---|---|
| January | 79,608 | 87,490 | 90,512 | 9.9 | 3.5 |
| February | 77,015 | 89,385 | 16.1 | ||
| March | 94,228 | 99,510 | 5.6 | ||
| April | 87,097 | 92,199 | 5.9 | ||
| May | 91,126 | 96,840 | 6.3 | ||
| June | 90,663 | 94,200 | 3.9 | ||
| July | 84,952 | 87,691 | 3.2 | ||
| August | 93,450 | 94,593 | 1.2 | ||
| September | 90,771 | 89,875 | -1.0 | ||
| October | 91,837 | 98,632 | 7.4 | ||
| November | 90,401 | 94,877 | 5.0 | ||
| December | 86,775 | 84,695 | -2.4 | ||
| Year-to-date | 79,608 | 87,490 | 90,512 | 9.9 | 3.5 |
| Annual | 1,057,924 | 1,109,988 | 4.9 |
Source: Bureau of Transportation Statistics, TransBorder Freight Data, https://data.bts.gov/stories/s/myhq-rm6q
NOTE: Numbers might not add to totals due to rounding. Percent changes based on numbers prior to rounding.
Table 2. U.S. Trade with NAFTA Partners by All Modes of Transportation
(millions of current dollars)
| Mode | January 2012 | December 2012 | January 2013 | Percent Change December 2012 - January 2013 | Percent Change January 2012 - 2013 | |
|---|---|---|---|---|---|---|
| All Modes | Imports | 48,266 | 46,103 | 49,513 | 7.4 | 2.6 |
| Exports | 39,224 | 38,591 | 40,999 | 6.2 | 4.5 | |
| Total | 87,490 | 84,695 | 90,512 | 6.9 | 3.5 | |
| All Surface Modes | Imports | 39,754 | 37,346 | 40,548 | 8.6 | 2.0 |
| Exports | 32,138 | 30,100 | 33,417 | 11.0 | 4.0 | |
| Total | 71,892 | 67,446 | 73,965 | 9.7 | 2.9 | |
| Truck | Imports | 25,280 | 23,239 | 25,684 | 10.5 | 1.6 |
| Exports | 26,866 | 24,796 | 28,014 | 13.0 | 4.3 | |
| Total | 52,146 | 48,035 | 53,698 | 11.8 | 3.0 | |
| Rail | Imports | 7,754 | 9,006 | 8,386 | -6.9 | 8.2 |
| Exports | 4,562 | 4,697 | 4,518 | -3.8 | -1.0 | |
| Total | 12,316 | 13,703 | 12,904 | -5.8 | 4.8 | |
| Pipeline | Imports | 6,720 | 5,101 | 6,478 | 27.0 | -3.6 |
| Exports | 710 | 607 | 885 | 45.9 | 24.8 | |
| Total | 7,430 | 5,708 | 7,363 | 29.0 | -0.9 | |
| Vessel | Imports | 5,930 | 5,628 | 5,809 | 3.2 | -2.0 |
| Exports | 2,624 | 3,492 | 3,020 | -13.5 | 15.1 | |
| Total | 8,554 | 9,120 | 8,829 | -3.2 | 3.2 | |
| Air | Imports | 1,383 | 1,591 | 1,497 | -5.9 | 8.2 |
| Exports | 2,019 | 2,097 | 1,955 | -6.7 | -3.2 | |
| Total | 3,402 | 3,688 | 3,452 | -6.4 | 1.5 |
Source: Bureau of Transportation Statistics, TransBorder Freight Data, https://data.bts.gov/stories/s/myhq-rm6q
NOTES: Numbers might not add to totals due to rounding. Percent changes based on numbers prior to rounding. The value of trade for all surface modes is not equal to the sum of truck, rail and pipeline modes, it also includes shipments made by mail, foreign trade zones, and other transportation. For additional detail, please refer to the TransBorder web page: https://data.bts.gov/stories/s/myhq-rm6q
Table 3. January 2013 Total Trade with NAFTA Partners Compared with January of Prior Years
| Compared to January in… | Percent Change | ||
|---|---|---|---|
| Imports | Exports | Total Trade | |
| 2012 | 2.6 | 4.5 | 3.5 |
| 2011 | 12.3 | 15.4 | 13.7 |
| 2010 | 33.1 | 43.0 | 37.4 |
| 2009 | 66.4 | 66.8 | 66.6 |
| 2008 | 14.4 | 27.0 | 19.8 |
| 2007 | 24.2 | 44.2 | 32.5 |
| 2006 | 19.4 | 47.0 | 30.5 |
| 2005 | 46.4 | 65.5 | 54.5 |
| 2004 | 66.5 | 90.3 | 76.5 |
Source: Bureau of Transportation Statistics, TransBorder Freight Data, https://data.bts.gov/stories/s/myhq-rm6q
Table 4. U.S. Trade with Canada by All Modes of Transportation
(millions of current dollars)
| Mode | January 2012 | December 2012 | January 2013 | Percent Change December 2012 - January 2013 | Percent Change January 2012 - 2013 | |
|---|---|---|---|---|---|---|
| All Modes | Imports | 26,773 | 25,798 | 27,963 | 8.4 | 4.4 |
| Exports | 21,969 | 22,191 | 23,049 | 3.9 | 4.9 | |
| Total | 48,742 | 47,989 | 51,013 | 6.3 | 4.7 | |
| All Surface Modes | Imports | 23,265 | 21,115 | 23,570 | 11.6 | 1.3 |
| Exports | 18,183 | 17,810 | 18,822 | 5.7 | 3.5 | |
| Total | 41,448 | 38,925 | 42,392 | 8.9 | 2.3 | |
| Truck | Imports | 10,985 | 10,130 | 11,294 | 11.5 | 2.8 |
| Exports | 15,435 | 14,803 | 15,774 | 6.6 | 2.2 | |
| Total | 26,420 | 24,933 | 27,068 | 8.6 | 2.5 | |
| Rail | Imports | 5,580 | 5,903 | 5,816 | -1.5 | 4.2 |
| Exports | 2,303 | 2,664 | 2,431 | -8.7 | 5.6 | |
| Total | 7,883 | 8,567 | 8,247 | -3.7 | 4.6 | |
| Pipeline | Imports | 6,700 | 5,082 | 6,460 | 27.1 | -3.6 |
| Exports | 445 | 343 | 617 | 80.1 | 38.6 | |
| Total | 7,145 | 5,425 | 7,077 | 30.5 | -1.0 | |
| Vessel | Imports | 1,958 | 2,472 | 2,209 | -10.6 | 12.8 |
| Exports | 478 | 937 | 891 | -4.9 | 86.3 | |
| Total | 2,436 | 3,409 | 3,100 | -9.1 | 27.3 | |
| Air | Imports | 736 | 950 | 893 | -6.0 | 21.3 |
| Exports | 1,434 | 1,504 | 1,353 | -10.0 | -5.7 | |
| Total | 2,170 | 2,454 | 2,246 | -8.5 | 3.5 |
Source: Bureau of Transportation Statistics, TransBorder Freight Data, https://data.bts.gov/stories/s/myhq-rm6q
NOTES: Percent changes based on numbers prior to rounding. The value of trade for all surface modes is not equal to the sum of truck, rail and pipeline modes, it also includes shipments made by mail, foreign trade zones, and other transportation. For additional detail, please refer to the TransBorder web page: https://data.bts.gov/stories/s/myhq-rm6q
Table 5. Top 10 States Trading with Canada by All Modes of Transportation
Ranked by January 2013 Trade Value
(millions of current dollars)
| State | January 2012 | January 2013 | Percent Change January 2012- 2013 | ||
|---|---|---|---|---|---|
| Value | Rank | Value | Rank | ||
| Michigan | 5,786 | 1 | 5,676 | 1 | -1.9 |
| Illinois | 5,099 | 2 | 5,059 | 2 | -0.8 |
| Texas | 3,119 | 4 | 3,222 | 3 | 3.3 |
| Ohio | 2,904 | 5 | 3,221 | 4 | 10.9 |
| California | 3,208 | 3 | 3,026 | 5 | -5.7 |
| New York | 2,603 | 6 | 2,915 | 6 | 12.0 |
| Washington | 1,876 | 8 | 1,979 | 7 | 5.5 |
| Pennsylvania | 1,987 | 7 | 1,938 | 8 | -2.5 |
| Indiana | 1,439 | 11 | 1,609 | 9 | 11.8 |
| Minnesota | 1,576 | 9 | 1,512 | 10 | -4.1 |
Source: Bureau of Transportation Statistics, TransBorder Freight Data, https://data.bts.gov/stories/s/myhq-rm6q
NOTES: Numbers might not add to totals due to rounding. Percent changes based on numbers prior to rounding.
Table 6. Top Commodity Transported between the U.S. and Canada for Each Mode of Transportation, January 2013
(millions of current dollars)
| Mode | Commodities | Exports | Imports | Total |
|---|---|---|---|---|
| Truck | Computer-Related Machinery and Parts | 2,996 | 1,396 | 4,392 |
| Rail | Vehicles Other than Railway | 582 | 2,266 | 2,848 |
| Pipeline | Mineral Fuels; Oils and Waxes | 617 | 6,439 | 7,056 |
| Vessel | Mineral Fuels; Oils and Waxes | 701 | 2021 | 2,722 |
| Air | Electrical Machinery; Equipment and Parts | 305 | 131 | 436 |
Source: Source: Bureau of Transportation Statistics, TransBorder Freight Data, https://data.bts.gov/stories/s/myhq-rm6q
NOTE: Numbers may not add to totals due to rounding.
Table 7. U.S. Trade with Mexico by All Modes of Transportation
(millions of current dollars)
| Mode | January 2012 | December 2012 | January 2013 | Percent Change December 2012 - January 2013 | Percent Change January 2012 - 2013 | |
|---|---|---|---|---|---|---|
| All Modes | Imports | 21,494 | 20,305 | 21,550 | 6.1 | 0.3 |
| Exports | 17,255 | 16,401 | 17,949 | 9.4 | 4.0 | |
| Total | 38,748 | 36,705 | 39,499 | 7.6 | 1.9 | |
| All Surface Modes | Imports | 16,488 | 16,231 | 16,977 | 4.6 | 3.0 |
| Exports | 13,954 | 12,290 | 14,596 | 18.8 | 4.6 | |
| Total | 30,442 | 28,521 | 31,573 | 10.7 | 3.7 | |
| Truck | Imports | 14,295 | 13,110 | 14,389 | 9.8 | 0.7 |
| Exports | 11,431 | 9,993 | 12,241 | 22.5 | 7.1 | |
| Total | 25,726 | 23,103 | 26,630 | 15.3 | 3.5 | |
| Rail | Imports | 2,173 | 3,102 | 2,570 | -17.2 | 18.2 |
| Exports | 2,259 | 2,033 | 2,087 | 2.6 | -7.6 | |
| Total | 4,432 | 5,135 | 4,657 | -9.3 | 5.1 | |
| Pipeline | Imports | 20 | 19 | 18 | -5.1 | -11.9 |
| Exports | 264 | 264 | 268 | 1.5 | 1.4 | |
| Total | 284 | 283 | 286 | 1.1 | 0.7 | |
| Vessel | Imports | 3,972 | 3,157 | 3,600 | 14.0 | -9.4 |
| Exports | 2,145 | 2,555 | 2,129 | -16.7 | -0.7 | |
| Total | 6,117 | 5,712 | 5,729 | 0.3 | -6.3 | |
| Air | Imports | 647 | 641 | 604 | -5.8 | -6.7 |
| Exports | 585 | 593 | 602 | 1.6 | 3.0 | |
| Total | 1,232 | 1,234 | 1,206 | -2.3 | -2.1 |
Source: Bureau of Transportation Statistics, TransBorder Freight Data, https://data.bts.gov/stories/s/myhq-rm6q
NOTE: Percent changes based on numbers prior to rounding.
Table 8. Top 10 States Trading with Mexico by All Modes of Transportation
Ranked by January 2013 Trade Value
(millions of current dollars)
| State | January 2012 | January 2013 | Percent Change January 2012- 2013 | ||
|---|---|---|---|---|---|
| Value | Rank | Value | Rank | ||
| Texas | 15,604 | 1 | 15,887 | 1 | 1.8 |
| California | 4,975 | 2 | 4,748 | 2 | -4.6 |
| Michigan | 3,147 | 3 | 3,540 | 3 | 12.5 |
| Illinois | 1,219 | 4 | 1,335 | 4 | 9.5 |
| Arizona | 1,141 | 5 | 1,216 | 5 | 6.5 |
| Ohio | 851 | 7 | 1,013 | 6 | 19.1 |
| Louisiana | 1,050 | 6 | 859 | 7 | -18.2 |
| Tennessee | 726 | 8 | 790 | 8 | 8.8 |
| Georgia | 513 | 13 | 576 | 9 | 12.2 |
| Indiana | 572 | 10 | 572 | 10 | -0.02 |
Source: Bureau of Transportation Statistics, TransBorder Freight Data, https://data.bts.gov/stories/s/myhq-rm6q
NOTE: Numbers may not add to totals due to rounding.
Table 9. Top Commodity Transported between the U.S. and Mexico for Each Mode of Transportation, January 2013
(millions of current dollars)
| Mode | Commodities | Exports | Imports | Total |
|---|---|---|---|---|
| Truck | Electrical Machinery; Equipment and Parts | 2,863 | 4,056 | 6,920 |
| Rail | Vehicles Other than Railway | 444 | 1,926 | 2,370 |
| Pipeline | Mineral Fuels; Oils and Waxes | 268 | 18 | 286 |
| Vessel | Mineral Fuels; Oils and Waxes | 1,240 | 3248 | 4,489 |
| Air | Electrical Machinery; Equipment and Parts | 208 | 163 | 371 |
Source: Bureau of Transportation Statistics, TransBorder Freight Data, https://data.bts.gov/stories/s/myhq-rm6q