
North American Transborder Freight up 13.9% in October 2022 from October 2021
BTS 01-23
*Transborder freight is measured by value and is not adjusted for seasonal variation or inflation.
The statistics in this release may not reflect changes in tonnage moved.
Total Transborder Freight by Border in October 2022, Compared to October 2021:
Transborder freight between the U.S. and North American countries (Canada and Mexico) in October 2022:
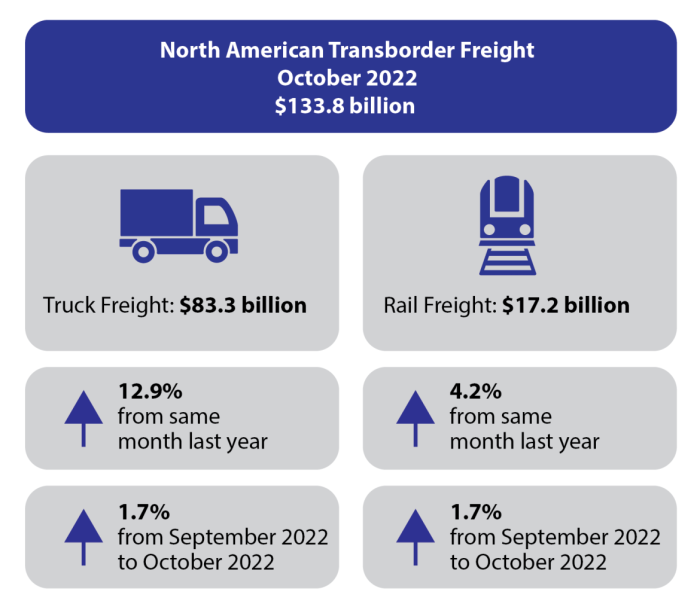
- Total transborder freight: $133.8 billion of transborder freight moved by all modes of transportation, up 13.9% compared to October 2021
- Freight between the U.S. and Canada totaled $65.4 billion, up 11.6% from October 2021
- Freight between the U.S. and Mexico totaled $68.4 billion, up 16.2% from October 2021
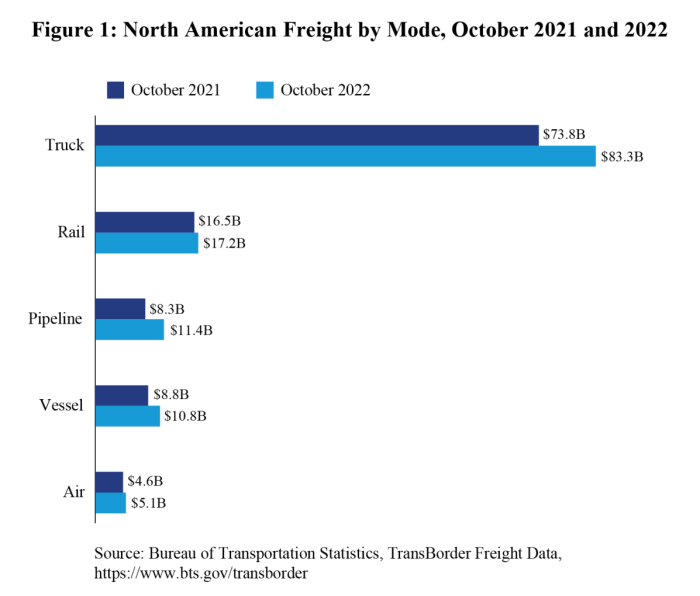
- Trucks moved $83.3 billion of freight, up 12.9% compared to October 2021
- Railways moved $17.2 billion of freight, up 4.2% compared to October 2021
- Pipelines moved $11.4 billion of freight, up 37.3% compared to October 2021
- Vessels moved $10.8 billion of freight, up 22.7% compared to October 2021
Total Transborder Freight by Border and Mode:
|
U.S.-Canada (both directions) (Dollars in Billions) |
U.S.-Mexico (both directions) (Dollars in Billions) |
||
| Truck: | $35.1 | Truck: | $48.2 |
| Pipeline: | $10.3 | Rail: | $7.9 |
| Rail: | $9.2 | Vessel: | $7.6 |
| Air: | $3.3 | Air: | $1.8 |
| Vessel: | $3.2 | Pipeline: | $1.1 |
The value of oil increased by 7.4% in October 2022 compared to October 2021, which contributed to large year-over-year increases in the value of freight moved by pipeline and vessel 1,2. Chicago, Port Huron, and Minneapolis are the top pipeline connection regions for U.S. energy freight flows with Canada. El Paso, Hidalgo, and Laredo are the top pipeline connection regions for the Southern border.
| U.S.-Canada Trade Breakdown | U.S.-Mexico Trade Breakdown | ||
| Top three truck ports | Top three truck ports | ||
| Detroit, MI | $10.0 billion | Laredo, TX | $21.5 billion |
| Port Huron, MI | $5.9 billion | El Paso-Ysleta, TX | $7.1 billion |
| Buffalo, NY | $5.6 billion | Otay Mesa, CA | $5.4 billion |
| Top three truck commodities | Top three truck commodities | ||
| Computers/parts | $5.7 billion | Electrical machinery | $11.1 billion |
| Vehicles/parts | $4.7 billion | Computers/parts | $11.0 billion |
| Electrical machinery | $2.4 billion | Vehicles/parts | $6.6 billion |
| Top three rail ports | Top three rail ports | ||
| Detroit, MI | $2.3 billion | Laredo, TX | $4.3 billion |
| Port Huron, MI | $2.1 billion | Eagle Pass, TX | $2.1 billion |
| Int'l Falls, MN | $1.3 billion | Nogales, AZ | $0.7 billion |
| Top three rail commodities | Top three rail commodities | ||
| Vehicles/parts | $3.1 billion | Vehicles/parts | $4.1 billion |
| Mineral fuel | $0.9 billion | Computers/parts | $0.6 billion |
| Plastics | $0.6 billion | Beverages | $0.4 billion |
Reporting Notes
Data in this Bureau of Transportation Statistics release are not seasonally adjusted and are not adjusted for inflation. For previous statistical releases and summary tables, see transborder releases. See transborder freight data for data from previous months, and additional state, port, and commodity data. BTS has scheduled the next release of transborder numbers for January 26, 2023.