
North American Transborder Freight up 19.1% in July 2022 from July 2021
BTS 42-22
Total Transborder Freight by Border in July 2022, Compared to July 2021:
Transborder freight between the U.S. and North American countries (Canada and Mexico) in July 2022:
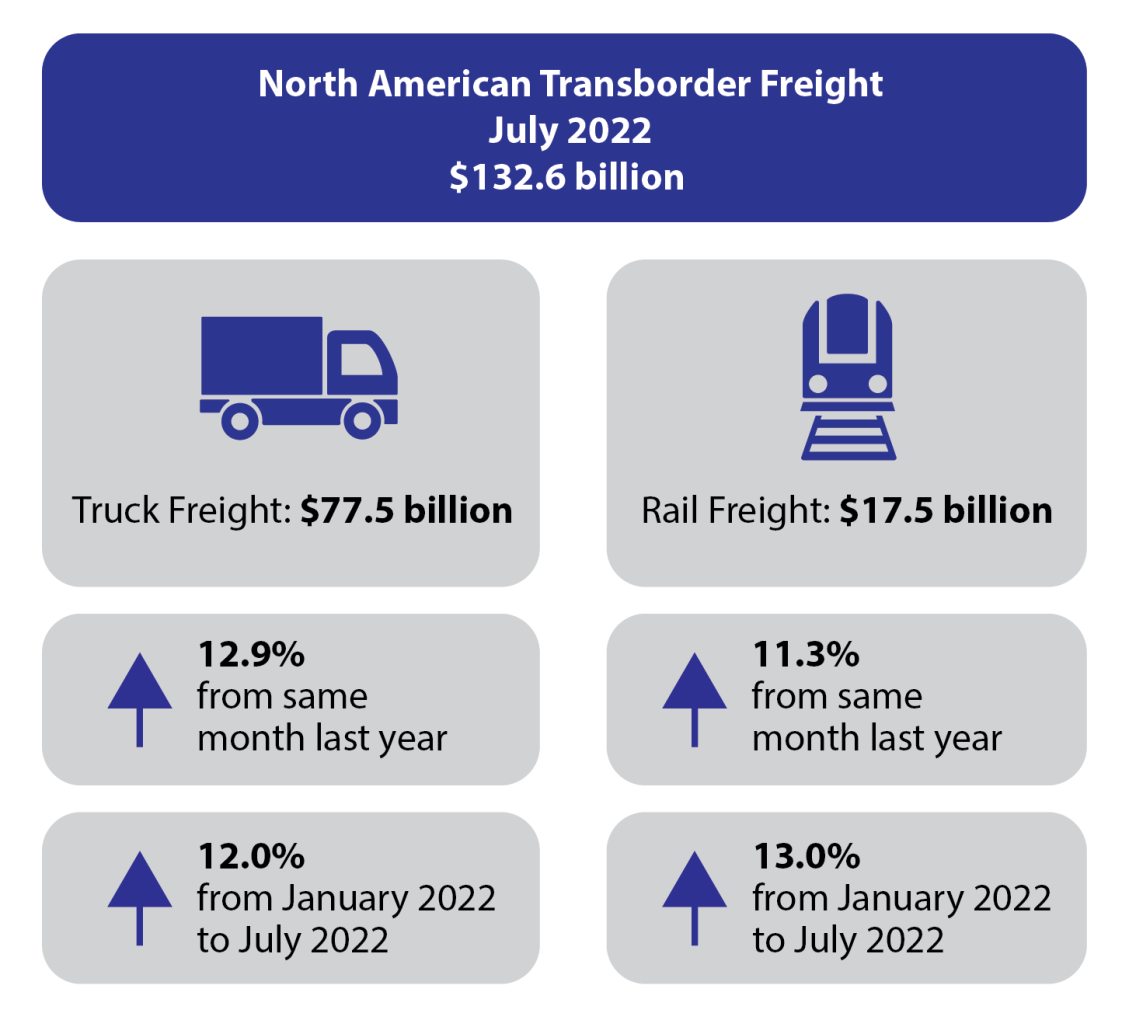
- Total transborder freight: $132.6 billion of transborder freight moved by all modes of transportation, up 19.1% compared to July 2021 (1)
- Freight between the U.S. and Canada totaled $67.4 billion, up 21.0% from July 2021
- Freight between the U.S. and Mexico totaled $65.2 billion, up 17.2% from July 2021
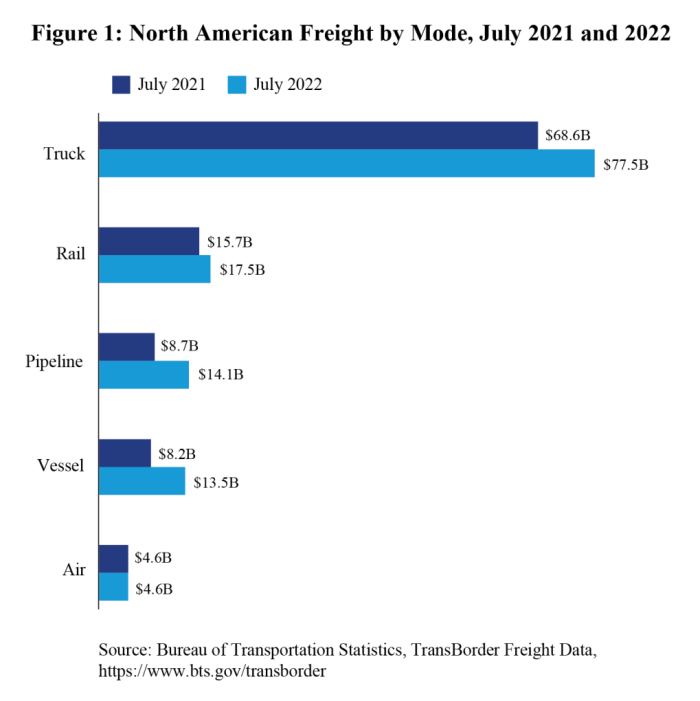
- Trucks moved $77.5 billion of freight, up 12.9% compared to July 2021
- Railways moved $17.5 billion of freight, up 11.3% compared to July 2021
Total Transborder Freight by Border and Mode:
| U.S.-Canada (both directions) (Dollars in Billions) Truck: $33.5 Rail: $9.8 Pipeline: $12.6 Vessel: $4.8 Air: $2.9 |
U.S.-Mexico (both directions) (Dollars in Billions) Truck: $44.0 Rail: $7.7 Vessel: $8.7 Air: $1.6 Pipeline: $1.4 |
The value of oil increased by 40.2% in July 2022 compared to July 2021, and 149.6% compared to July 2020. (2)(3) Over 99% of pipeline freight between the U.S. and Canada are mineral fuels, primarily oil and gas. Freight by vessel between the U.S. and Mexico comprises 50% of mineral fuel shipments between Gulf of Mexico ports.
Truck Freight: $77.5 billion (58.5% of all transborder freight)
- U.S.-Canada: $33.5 billion
- U.S.-Mexico: $44.0 billion
- Top three busiest truck border ports
- Laredo, TX $19.4 billion
- Detroit, MI $9.0 billion
- El Paso-Ysleta, TX $6.2 billion
- Top three truck commodities
- Computers and parts $15.3 billion
- Electrical machinery $11.9 billion
- Vehicles and parts $9.9 billion
Rail Freight: $17.5 billion (13.2% of all transborder freight)
- U.S.-Canada: $9.8 billion
- U.S.-Mexico: $7.7 billion
- Top three busiest rail border ports
- Laredo, TX $4.3 billion
- Port Huron, MI $2.3 billion
- Detroit, MI $2.2 billion
- Top three rail commodities
- Vehicles and parts $6.2 billion
- Mineral fuels $1.6 billion
- Plastics $1.2 billion
Reporting Notes
Data in this Bureau of Transportation Statistics release are not seasonally adjusted and are not adjusted for inflation. For previous statistical releases and summary tables, see transborder releases. See transborder freight data for data from previous months, and for additional state, port, and commodity data. BTS has scheduled the next release of transborder numbers for October 25, 2022.