
North American Transborder Freight increased 1.2% in December 2025 from December 2024
BTS 26-21
This release is published on a fixed schedule as required by the Office of Management and Budget, and statistics in this release may be revised when inputs to the statistics are corrected or updated. Data on the program page of this website are the most up-to-date and complete.
The transborder freight data program provides comprehensive monthly and annual data on North American cross-border freight activity, detailing the value of U.S. imports and exports with Canada and Mexico by mode of transportation, commodity, and geography. These data inform critical infrastructure planning, trade corridor studies, and logistics research. This data release is for December 2025 and is available online at the transborder program homepage.
Total Transborder Freight by Border in December 2025, Compared to December 2024:
- Transborder freight between the U.S. and North American countries, Canada and Mexico:
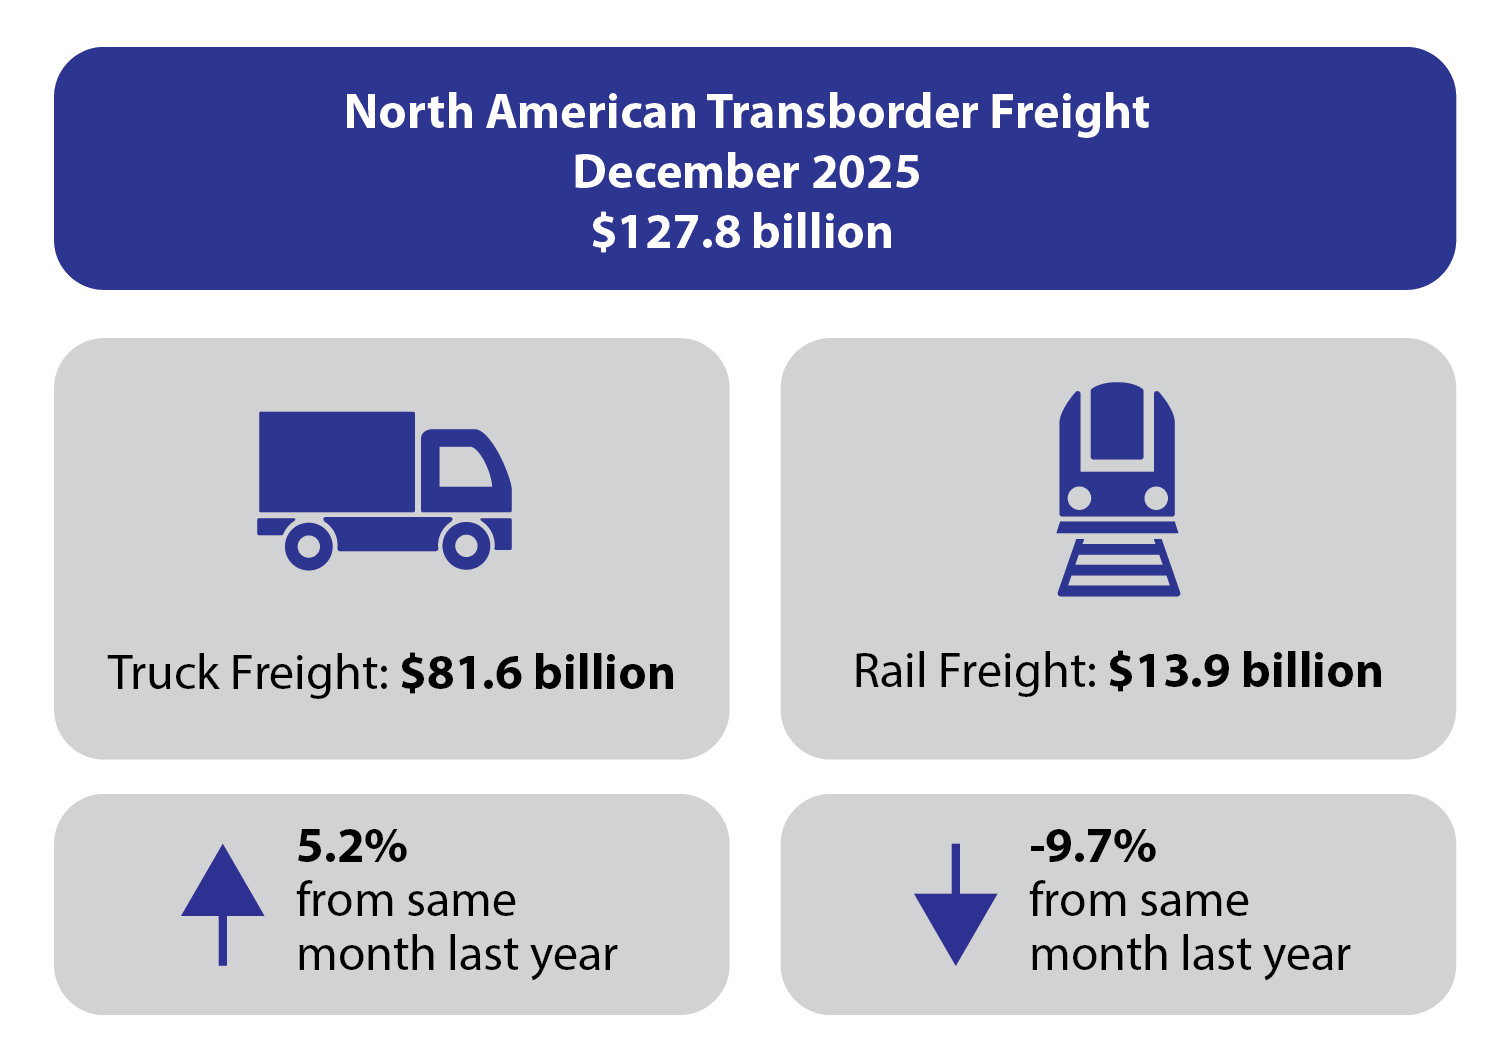
- Total transborder freight: $127.8 billion of transborder freight moved by all modes of transportation, increasing 1.2% compared to December 2024
- Freight between the U.S. and Canada: $57.3 billion, down 8.3% from December 2024
- Freight between the U.S. and Mexico: $70.5 billion, up 10.5% from December 2024
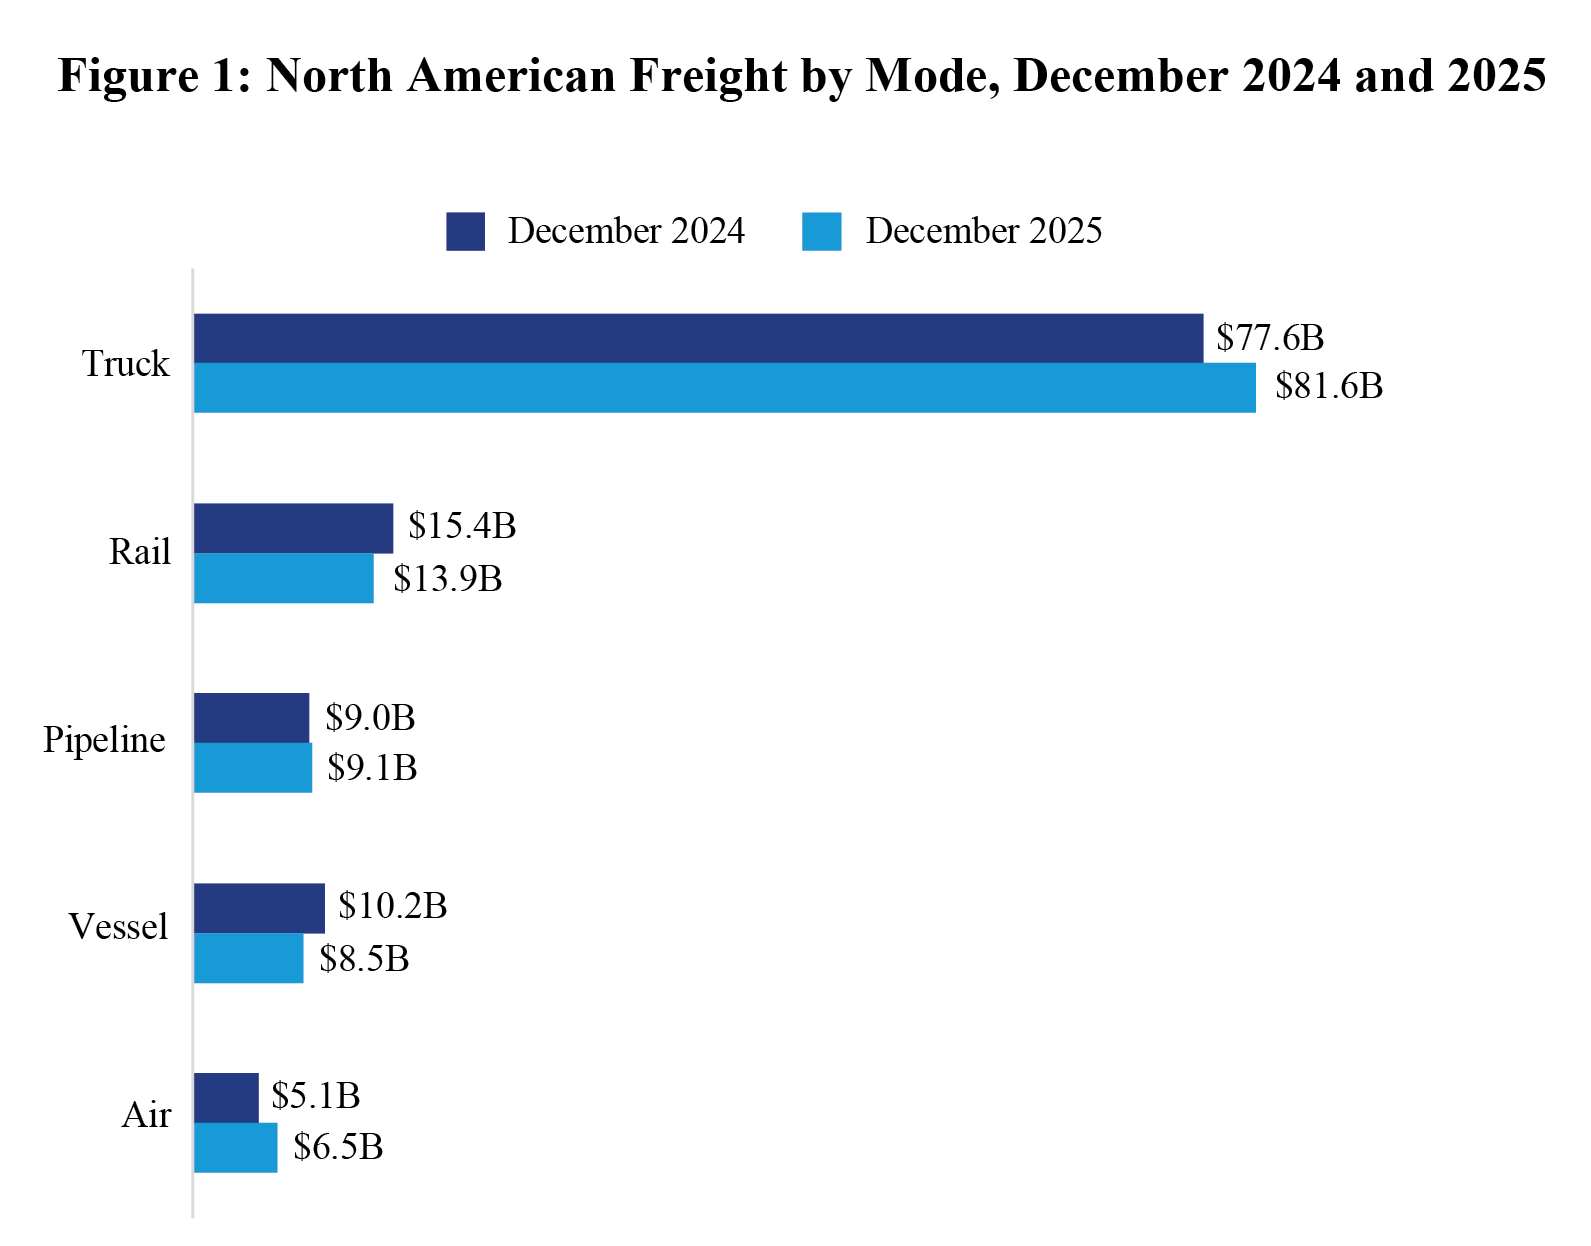
- Trucks moved $81.6 billion of freight, up 5.2% compared to December 2024
- Railways moved $13.9 billion of freight, down 9.7% compared to December 2024
- Pipelines moved $9.2 billion of freight, up 2.1% compared to December 2024
- Vessels moved $8.5 billion of freight, down 16.2% compared to December 2024
- Air moved $6.5 billion of freight, up 27.8% compared to December 2024
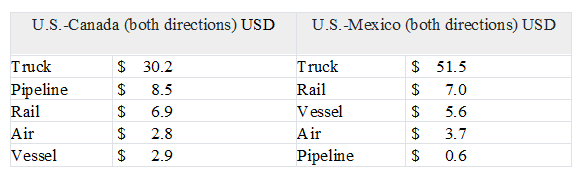
Total Transborder Freight by Border and Mode
Detroit, Port Huron, and Buffalo are the top truck ports for U.S. freight flows with Canada, while Laredo, El Paso, and Otay Mesa are the top truck ports with Mexico. Detroit, Port Huron, and International Falls are the top rail connection ports for U.S. freight flows with Canada, while Laredo, Eagle Pass, and El Paso are the top rail connection ports with Mexico. Chicago, Port Huron, and Minneapolis are the top pipeline connection regions for U.S. energy freight flows with Canada. El Paso, Hidalgo, and Laredo are the top pipeline connection regions with Mexico. Port of Boston, Arthur, and Portland are the top water port connections for U.S. energy flows with Canada. Port of Houston, Arthur, and Texas City are the top water port connections for U.S. energy flows on the Southern border.
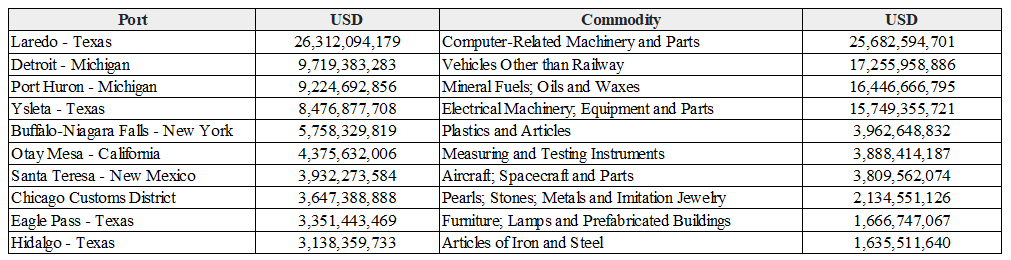
Top 10 Ports and Commodities
Reporting Notes
All monetary values are in current U.S. dollars and are not adjusted for inflation. For previous statistical releases and summary tables, see transborder releases. Visit the transborder freight program homepage for data from previous months, and additional state, port, and commodity data.