
North American Transborder Freight Value Nears $114 Billion in January 2022; Up 20.6% from January 2021 and 17.1% from Pre-pandemic January 2020
BTS 14-22
Trucking carries more than 60% of all January 2022 transborder trade value
Transborder freight between the U.S. and North American countries (Canada and Mexico) in January 2022:
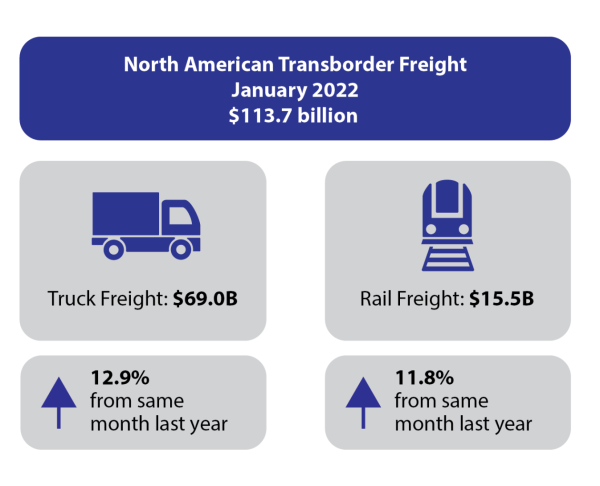
- Total transborder freight: $113.7 billion of transborder freight moved by all modes of transportation, up 20.6% compared to January 2021. January 2022 transborder freight was up 17.1% compared to $97.1 billion in January 2020.
- Freight between the U.S. and Canada totaled $56.8B. Freight between the U.S. and Mexico totaled $56.9B.
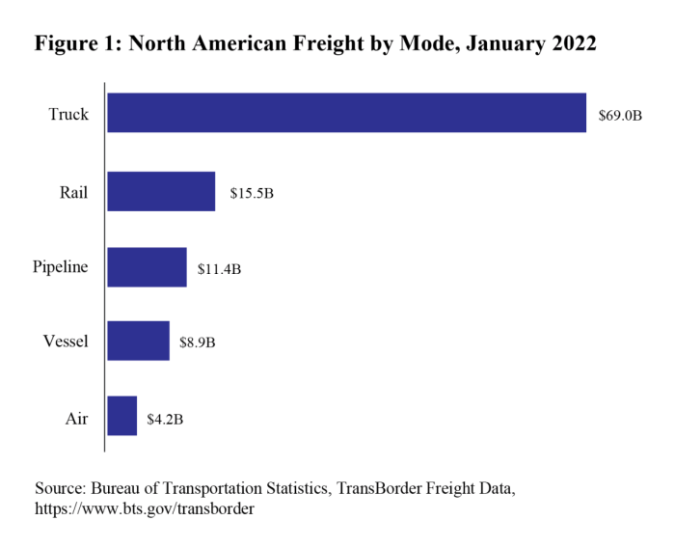
- Trucks moved $69.0 billion of freight, up 12.9% compared to January 2021.
- Railways moved $15.5 billion of freight, up 11.8% compared to January 2021.
Total Transborder Freight by Border Compared to January 2021:
- U.S.-Canada up 24.1%
- U.S.-Mexico up 17.3%
Total Transborder Freight by Border and Mode:
|
U.S.-Canada (both directions) |
U.S.-Mexico (both directions) |
Total Transborder Freight by Border and Commodity:
|
U.S.-Canada (both directions) |
U.S.-Mexico (both directions) |
Truck Freight: $69.0 billion (60.6% of all transborder freight)
- U.S.-Canada: $29.3 billion (51.5% of all northern border freight)
- U.S.-Mexico: $39.7 billion (69.7% of all southern border freight)
- Top three busiest truck border ports (44.4% of total transborder truck freight)
- Laredo, TX $16.9 billion
- Detroit, MI $8.5 billion
- Ysleta, TX $5.3 billion
- Top three truck commodities (46.0% of total transborder truck freight)
- Computers and parts $12.6 billion
- Electrical machinery $10.8 billion
- Vehicles and parts $8.4 billion
Rail Freight: $15.5 billion (13.6% of all transborder freight)
- U.S.-Canada: $8.4 billion (14.8% of all northern border freight)
- U.S.-Mexico: $7.1 billion (12.5% of all southern border freight)
- Top three busiest rail border ports (49.1% of total transborder rail freight)
- Laredo, TX $3.6 billion
- Eagle Pass, TX $2.0 billion
- Detroit, MI $2.0 billion
- Top three rail commodities (52.3% of total transborder rail freight)
- Vehicles and parts $5.6 billion
- Plastics $1.3 billion
- Mineral fuels $1.2 billion
Reporting Notes
Data in this Bureau of Transportation Statistics release are not seasonally adjusted and are not adjusted for inflation. For previous statistical releases and summary tables, see transborder releases. See transborder freight data for data from previous months, and for additional state, port, and commodity data. BTS has scheduled the release of February transborder numbers for April 19, 2022.