
November 2021 North American Transborder Freight Up 25.2% from 2020; Up 21.3% from Pre-Pandemic November 2019
BTS 05-22
Transborder freight between the U.S. and North American countries (Canada and Mexico) in November 2021:
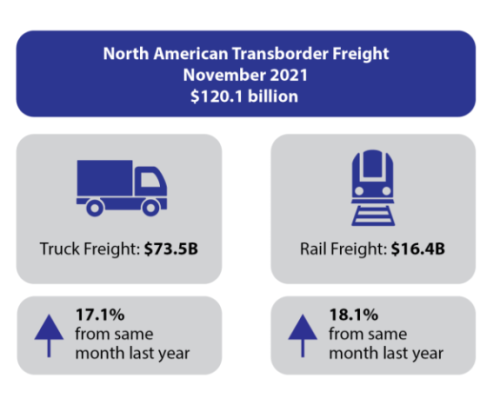
- Total transborder freight: $120.1 billion of transborder freight moved by all modes of transportation, an increase of 25.2% from $95.9 billion in November 2020.
- November 2021 transborder freight value increased 21.3% from $99.0 billion in pre-pandemic November 2019.
- Freight between the U.S. and Canada totaled $61.4B, up 31.4% from November 2020. Freight between the U.S. and Mexico totaled $58.7B, up 19.4% from November 2020.
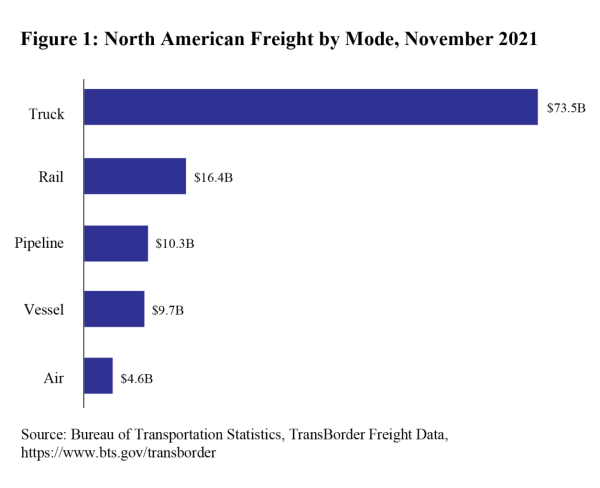
- Trucks moved $73.5 billion of freight, up 17.1% compared to November 2020.
- Railways moved $16.4 billion of freight, up 18.1% compared to November 2020.
Transborder Freight by Border and Mode:
U.S.-Canada (both directions)
(Dollars in Billions)
Truck: $32.9
Pipeline: $9.3
Rail: $8.9
Vessel: $3.5
Air: $2.9
U.S.-Mexico (both directions)
(Dollars in Billions)
Truck: $40.5
Rail: $7.5
Vessel: $6.2
Air: $1.7
Pipeline: $0.9
Truck Freight: $73.5 billion (61.2% of all transborder freight)
- U.S.-Canada: $32.9 billion (53.6% of all northern border freight)
- U.S.-Mexico: $40.5 billion (69.1% of all southern border freight)
- Top three busiest truck border ports (45.1% of total transborder truck freight)
- Laredo, TX $17.1 billion
- Detroit, MI $10.6 billion
- Ysleta, TX $5.4 billion
- Top three truck commodities (46.2% of total transborder truck freight)
- Computers and parts $13.5 billion
- Electrical machinery $11.1 billion
- Vehicles and parts $9.3 billion
Rail Freight: $16.4 billion (13.7% of all transborder freight)
- U.S.-Canada: $8.9 billion (14.5% of all northern border freight)
- U.S.-Mexico: $7.5 billion (12.8% of all southern border freight)
- Three busiest rail border ports (50.6% of total transborder rail freight)
- Laredo, TX $3.8 billion
- Eagle Pass, TX $2.4 billion
- Detroit, MI $2.1 billion
- Top three rail commodities (54.8% of total transborder rail freight)
- Vehicles and parts $6.5 billion
- Mineral fuels $1.3 billion
- Plastics and articles $1.2 billion
Reporting Notes
Data in this Bureau of Transportation Statistics release are not seasonally adjusted and are not adjusted for inflation. For previous statistical releases and summary tables, see transborder releases. See transborder freight data for data from previous months, and for additional state, port, and commodity data. BTS has scheduled the release of December transborder numbers for February 15, 2022.