
October 2018 U.S. Passenger Airline Employment Data
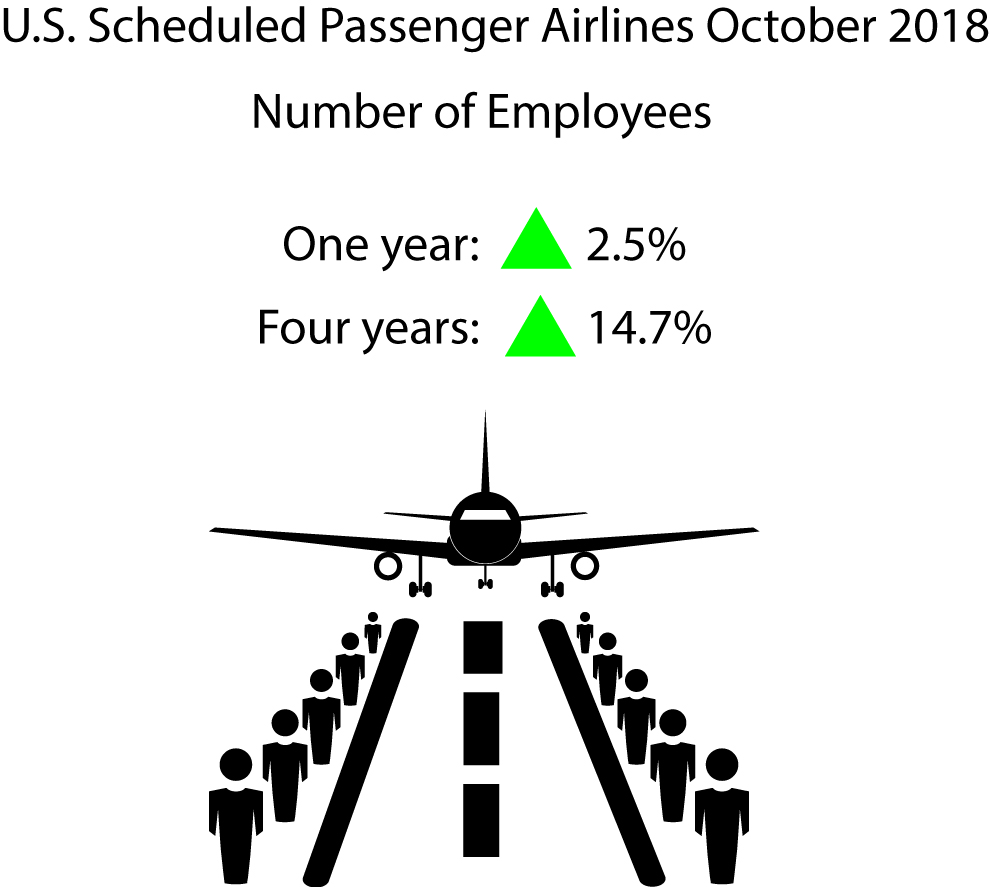
U.S. scheduled passenger airlines employed 2.5 percent more workers in October 2018 than in October 2017:
- October’s 441,139 full-time equivalents (FTE) was the second highest monthly employment total since 2004, exceeded only by July 2018 (443,475 FTEs).
- October was the 60th consecutive month that U.S. scheduled passenger airline FTEs exceeded the same month of the previous year.
Scheduled Passenger Airline Full-Time Equivalent Employees, Month of October, 1990-2018
| October FTEs in thousands (000) | 1 | ||||
|---|---|---|---|---|---|
| 1990 | 461.2 | 2 | |||
| 1991 | 429.7 | 3 | |||
| 1992 | 446.1 | 4 | |||
| 1993 | 439.9 | 5 |
FTE calculations count two part-time employees as one full-time employee.
Bureau of Transportation Statistics
All 21 scheduled service passenger airlines
- 441,139 FTEs
- Up 2.5 percent (10,907 FTEs) over October 2017 (430,232 FTEs)
- Up 14.7 percent (56,439 FTEs) over October 2014 (384,700 FTEs)
Four network airlines
- 284,765 FTEs, 64.6 percent of total scheduled passenger airline FTEs
- Up 2.2 percent (6,200 FTEs) over October 2017 (278,565 FTEs)
- Up 11.1 percent (28,356 FTEs) over October 2014 (256,409 FTEs)
Network airlines operate a significant portion of their flights using at least one hub where connections are made for flights to down-line destinations or spoke cities. Note that beginning with January 2018 data, Virgin America’s numbers are included with Alaska Airlines in the network category.
Five low-cost airlines
- 92,890 FTEs, 21.1 percent of total scheduled passenger airline FTEs
- Up 2.4 percent (2,139 FTEs) over October 2017 (90,751 FTEs)
- Up 28.8 percent (20,780 FTEs) over October 2014 (72,110 FTEs)
Low-cost airlines operate under a low-cost business model, with infrastructure and aircraft operating costs below the overall industry average.
10 regional airlines
- 55,426 FTEs, 12.6 percent of total scheduled passenger airline FTEs
- Up 4.1 percent (2,171 FTEs) over October 2017 (53,255 FTEs)
- Up 11.3 percent (5,637 FTEs) over October 2014 (49,789 FTEs)
Regional carriers typically provide service from small cities, using primarily regional jets to support the network carriers’ hub and spoke systems.
Top Employers by Group
- Network: American 102,121 FTEs
- Low-Cost: Southwest 58,787 FTEs
- Regional: SkyWest 14,212 FTEs
Two other airlines
Other carriers generally operate within specific niche markets. They are: Hawaiian Airlines and Sun Country Airlines.
Reporting Notes
Airlines that operate at least one aircraft that has more than 60 seats or the capacity to carry a payload of passengers, cargo and fuel weighing more than 18,000 pounds must report monthly employment statistics.
Data are compiled from monthly reports filed with BTS by commercial air carriers as of Dec. 6. Additional airline employment data and previous releases can be found on the BTS website. BTS has scheduled release of November passenger airline employment data for Jan. 17.