
October 2021 U.S. Airlines Passengers Increased 119% from October 2020, Remain 16% below Pre-Pandemic October 2019
BTS 78-21
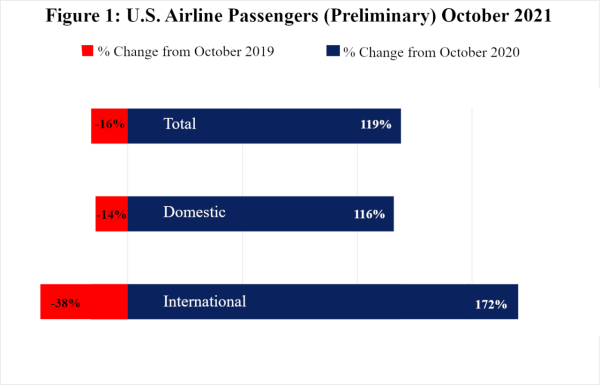
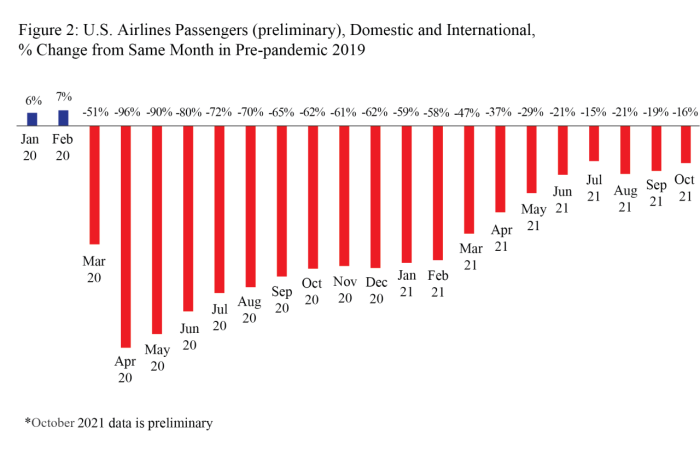
U.S. airlines carried 119.47% more scheduled service passengers in October 2021 than in October 2020 (preliminary), according to data filed with the Bureau of Transportation Statistics (BTS) by 23 airlines that carry more than 90% of the passengers. The increase from October 2020 was the smallest one-year increase since March (9.5%). Airline passenger volume remained 16.24% below October 2019, the most recent pre-pandemic corresponding month. The October 2021 air passenger difference relative to October 2019 is the smallest percent change from pre-pandemic 2019 since July (-15%).
The large airlines carried 65.6 million passengers in October 2021 (preliminary) compared to 29.9 million in October 2020 and 78.3 million in October 2019.
Preliminary October 2021 passenger numbers (23 carriers reporting):
- Total: 65.6 million passengers, up 119.47% from October 2020 (29.9M), down 16% from October 2019 (78.3 million)
- Domestic: 60.2 million passengers, up 116% from October 2020 (27.9M), down %14 from October 2019 (69.6 million)
- International: 5.3 million passengers, up 172% from October 2020 (2M), down 38%% from October 2019 (8.7 million)
U.S. airline traffic reports are filed monthly with BTS. Final October data will be released in January 2022. Complete international data by origin and destination, which is under a six-month confidentiality restriction, will be released in April 2022.
Table 1: Systemwide Percent Change in US Airlines Scheduled Service Passengers from the Same Month of the Previous Year, 2017-2021
|
Year-to-Year Percent Change |
||||
|
|
2017 - 2018 |
2018 - 2019 |
2019 - 2020 |
2020 - 2021 |
|
January |
3.0 |
5.2 |
5.7 |
-61.5 |
|
February |
5.8 |
4.2 |
6.7 |
-60.8 |
|
March |
4.6 |
6.4 |
-51.3 |
9.5 |
|
April |
6.0 |
3.9 |
-96.1 |
1492.3 |
|
May |
6.1 |
5.3 |
-90.1 |
617.3 |
|
June |
6.2 |
3.7 |
-80.3 |
300.3 |
|
July |
6.4 |
3.7 |
-72.4 |
206.7 |
|
August |
6.3 |
3.5 |
-69.8 |
164.6 |
|
September |
7.1 |
5.7 |
-65.2 |
132.5 |
|
October |
5.0 |
4.2 |
-61.8 |
119.5* |
|
November |
5.7 |
0.5 |
-60.7 |
|
|
December |
4.8 |
8.9 |
-61.5 |
|
|
Jan - Oct |
5.7 |
4.5 |
-60.0 |
72.2 |
|
Annual |
5.6 |
4.6 |
-60.2 |
|
Source: Bureau of Transportation Statistics, T-100 Market
* October 2021 data is preliminary
Domestic Passengers
- October 2021 passengers: 60.2M
- Change from October 2020: 116%
- Percent of 2020 passengers: 216%
- Change from October 2019: -14%
- Percent of 2019 passengers: 87%
- Domestic percent of total October 2021 passengers: 92%
- Domestic percent of total October 2020 passengers: 93%
- Domestic percent of total October 2019 passengers: 89%
Table 2: Domestic Percent Change in US Airlines Scheduled Service Passengers from the Same Month of the Previous Year, 2017-2021
|
Year-to-Year Percent Change |
||||
|
|
2017 - 2018 |
2018 - 2019 |
2019 - 2020 |
2020 - 2021 |
|
January |
3.3 |
5.3 |
6.2 |
-60.6 |
|
February |
6.0 |
4.2 |
7.5 |
-59.1 |
|
March |
4.2 |
6.7 |
-51.0 |
14.3 |
|
April |
7.0 |
3.8 |
-95.7 |
1,426.5 |
|
May |
6.6 |
5.3 |
-89.0 |
571.6 |
|
June |
6.6 |
3.6 |
-77.9 |
272.8 |
|
July |
7.2 |
3.9 |
-69.6 |
191.1 |
|
August |
6.9 |
3.5 |
-67.1 |
153.3 |
|
September |
7.2 |
5.9 |
-62.7 |
125.8 |
|
October |
5.0 |
4.3 |
-59.9 |
115.8* |
|
November |
5.8 |
0.3 |
-59.4 |
|
|
December |
5.0 |
9.6 |
-60.9 |
|
|
Jan - Oct |
6.0 |
4.6 |
-58.4 |
72.8 |
|
Annual |
5.9 |
4.6 |
-58.7 |
|
Source: Bureau of Transportation Statistics, T-100 Domestic Market
*October 2021 data is preliminary
International Passengers
- October 2021 passengers: 5.3M
- Change from October 2020: 172%
- Percent of 2020 passengers: 272%
- Change from October 2019: -38%
- Percent of 2019 passengers: 62%
- International percent of total October 2021 passengers: 8%
- International percent of total October 2020 passengers: 7%
- International percent of total October 2019 passengers: 11%
Table 3: International Percent Change in US Airlines Scheduled Service Passengers from the Same Month of the Previous Year, 2017-2021
|
Year-to-Year Percent Change |
||||
|
|
2017 - 2018 |
2018 - 2019 |
2019 - 2020 |
2020 - 2021 |
|
January |
1.3 |
4.8 |
2.1 |
-67.5 |
|
February |
4.8 |
3.8 |
1.0 |
-73.4 |
|
March |
7.4 |
3.8 |
-53.3 |
-25.7 |
|
April |
-0.6 |
4.7 |
-98.6 |
2,923.3 |
|
May |
2.7 |
5.7 |
-98.1 |
2,530.0 |
|
June |
3.7 |
4.3 |
-96.4 |
1,414.6 |
|
July |
1.9 |
2.3 |
-90.4 |
525.8 |
|
August |
2.5 |
3.9 |
-87.5 |
360.0 |
|
September |
6.3 |
4.7 |
-83.7 |
245.1 |
|
October |
4.6 |
3.4 |
-77.3 |
171.7* |
|
November |
5.0 |
2.4 |
-70.3 |
|
|
December |
3.6 |
4.0 |
-66.0 |
|
|
Jan - Oct |
3.3 |
4.1 |
-70.8 |
66.2 |
|
Annual |
3.5 |
4.0 |
-70.4 |
|
Source: Bureau of Transportation Statistics, T-100 International Market
*October 2021 data is preliminary
Reporting Notes
Data are compiled from monthly reports filed with BTS by commercial U.S. air carriers detailing operations, passenger traffic and freight traffic. This release includes data received by BTS from U.S. airlines as of December 10, 2021.
See the BTS Airlines and Airport page for additional U.S. airlines numbers through September 2021 for U.S. airlines. International data by origin and destination is available through June 2021.
None of the data are from samples. Measures of statistical significance do not apply to the complete air traffic data.