
Second Quarter 2020 Air Fare Drops to New Low as Passenger Numbers Decline
U.S. domestic air fares declined in the second quarter of 2020 to $259, the lowest inflation-adjusted quarterly air fare in Bureau of Transportation Statistics (BTS) records dating back to 1995. The previous low was $334 in the first quarter of 2020.
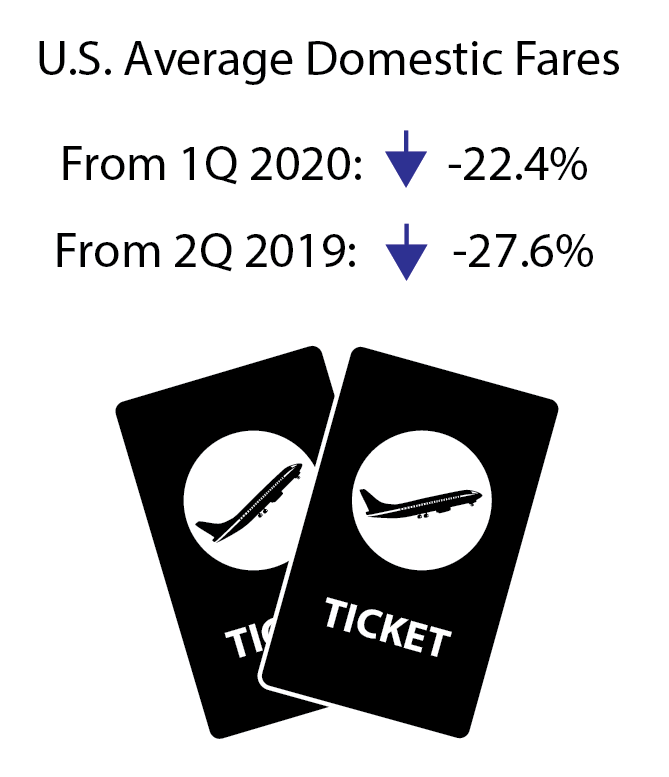
Adjusted for inflation (constant 2020 dollars) the 2Q 2020 air fare was:
- Down 27.8% from 2Q 2019 ($358)
- Down 22.6% from 1Q 2020 ($334)
- Down 38.4% from 2Q 2015 ($420)
Air fares declined along with passenger demand. Airlines reported 11.5 million originating passengers in the second quarter of 2020, down from 87.2 million passengers a year earlier.
The percent change is based on unrounded numbers. COVID-19 effects on travel were significant in the April-June reporting period.
Source: Bureau of Transportation Statistics, BTS Air Fares, Origin and Destination Survey
Figure 1. U.S. Average Domestic Fares, 2nd Quarter 1995-2020
| Unadjusted Fares (current dollars) | Inflation-Adjusted (2020$) | 1 | |
|---|---|---|---|
| 1995 | 297 | 501 | 2 |
| 1996 | 276 | 453 | 3 |
| 1997 | 289 | 464 | 4 |
| 1998 | 301 | 475 | 5 |
| 1999 | 329 | 509 | 6 |
| 2000 | 339 | 507 | 7 |
| 2001 | 329 | 476 | 8 |
| 2002 | 318 | 454 | 9 |
| 2003 | 315 | 440 | 10 |
| 2004 | 309 | 421 | 11 |
| 2005 | 307 | 405 | 12 |
| 2006 | 342 | 434 | 13 |
| 2007 | 325 | 402 | 14 |
| 2008 | 347 | 411 | 15 |
| 2009 | 302 | 362 | 16 |
| 2010 | 341 | 401 | 17 |
| 2011 | 370 | 421 | 18 |
| 2012 | 385 | 430 | 19 |
| 2013 | 378 | 417 | 20 |
| 2014 | 402 | 434 | 21 |
| 2015 | 389 | 420 | 22 |
| 2016 | 352 | 376 | 23 |
| 2017 | 356 | 374 | 24 |
| 2018 | 349 | 357 | 25 |
| 2019 | 357 | 358 | 26 |
| 2020 | 259 | 259 | 27 |
| 28 |
Bureau of Transportation Statistics, Origin and Destination Survey
Other Revenue: In recent years, airlines have increasingly obtained additional revenue from passenger fees, as well as from other sources. U.S. passenger airlines collected 67.6% of total operating revenue of $30.5 billion from passenger fares during the first six months of 2020, down from 88.5% in 1990.
Fares by Airport
Additional data: see Top 100 Airports or All Airports. Third Quarter 2020 average fare data will be released Jan. 19.
Standard error: Results for average fares are based on the BTS Origin & Destination Survey, a 10% sample of airline tickets used during the quarter. Averages for airports with smaller samples may be less reliable.
Note: Results for average fares are based on the BTS Origin & Destination Survey, a 10% sample of airline tickets used during the quarter. For Q2 2020 results based on all itinerary fares, the standard error is 0.39 and the median fare is $207.64. The 90% confidence interval ranges from $258.24 to $259.51. For results based on round-trip fares, the standard error is 0.61 and the median fare is $256.87. The 90% confidence interval ranges from $309.69 to $311.71. For results based on one-way fares, the standard error is 0.45 and the median fare is $182.06. The 90% confidence interval ranges from $219.55 to $221.01.