
September 2018 North American Transborder Freight Numbers
Transborder freight between the U.S. and other North American countries (Canada and Mexico) in September 2018:
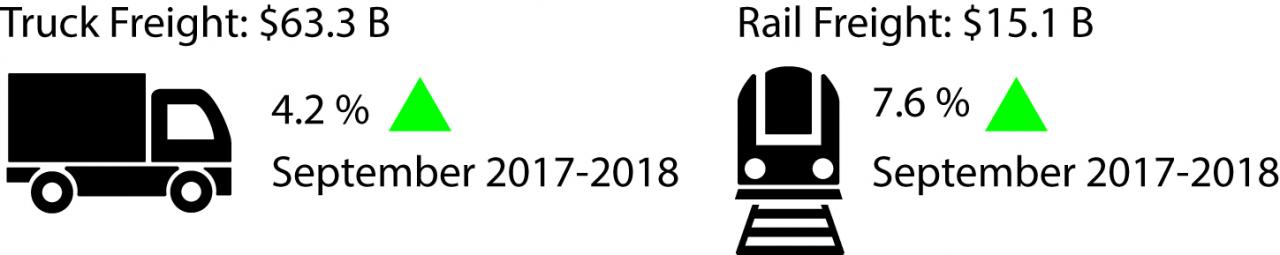
- Most-used mode: Truck moved $63.3 billion of freight, up 4.2 percent compared to September 2017
- Second mode: Rail moved $15.1 billion of freight, up 7.6 percent compared to September 2017
Truck Freight: $63.3 billion (62.2 percent of all transborder freight)
- By border:
- Compared to previous year:
- Busiest three truck border ports (46.1 percent of total transborder truck freight):
- Laredo, TX: $15.2 billion
- Detroit, MI: $8.8 billion
- El Paso, TX: $5.3 billion
- Top three truck commodities (51.9 percent of total transborder truck freight):
- Computers and parts: $12.3 billion
- Electrical machinery: $10.6 billion
- Motor vehicles and parts: $ 9.9 billion
Figure 1: North American Freight by Mode: September 2018
| Mode | Value | 1 |
|---|---|---|
| Truck | 63.3 | 2 |
| Rail | 15.1 | 3 |
| Vessel | 8.5 | 4 |
| Pipeline | 5.8 | 5 |
| Air | 4.1 | 6 |
| 7 |
Bureau of Transportation Statistics, TransBorder Freight Data, https://www.bts.gov/transborder
Rail Freight: $15.1 billion (14.8 percent of all transborder freight)
- By border:
- Compared to previous year:
- Busiest three rail border ports (52.0 percent of total transborder rail freight):
- Laredo, TX: $3.7 billion
- Detroit, MI: $2.2 billion
- Port Huron: MI: $2.0 billion
- Top three rail commodities (61.0 percent of total transborder rail freight):
- Motor vehicles and parts: $7.1 billion
- Mineral fuels: $1.2 billion
- Plastics: $0.9 billion
Total Transborder Freight: $101.6 billion of transborder freight moved by all modes of transportation, up 7.7 percent from September 2017.
Freight by Mode:
U.S.-Canada (both directions)
(Dollars in Billions)
Almost all (99.7 percent) of pipeline freight between the U.S. and Canada were mineral fuels, primarily oil and gas. Most of these freight flows were on pipelines linking Canada and the American Midwest.
U.S.-Mexico (both directions)
(Dollars in Billions)
Of freight by vessel between the U.S. and Mexico, $3.3 billion, or 56.9 percent were mineral fuels, primarily oil and gas shipments between Gulf of Mexico ports in the U.S. and Mexico – with over half of those shipments going through Texas ports.
Reporting Notes
Data in this Bureau of Transportation Statistics release are not seasonally adjusted and are not adjusted for inflation. For previous statistical releases and summary tables, see TransBorder Releases. See TransBorder Freight Data for data from previous months, and for additional state, port, and commodity data. BTS has scheduled the release of October TransBorder numbers for Jan. 4.