


Supply Chain Indicators - October 2026
Wednesday, October 14, 2026
Each month, the Bureau of Transportation Statistics (BTS) develops timely information, statistics, and data on the Nation’s Supply Chain and Freight Indicators.
This BTS freight information is organized into four sections:
- Port Data - Inside the Gate
- Port Data - Outside the Gate
- Freight Movement
- Transportation Labor and Capacity Tightness
This month, BTS updated the following indicators:
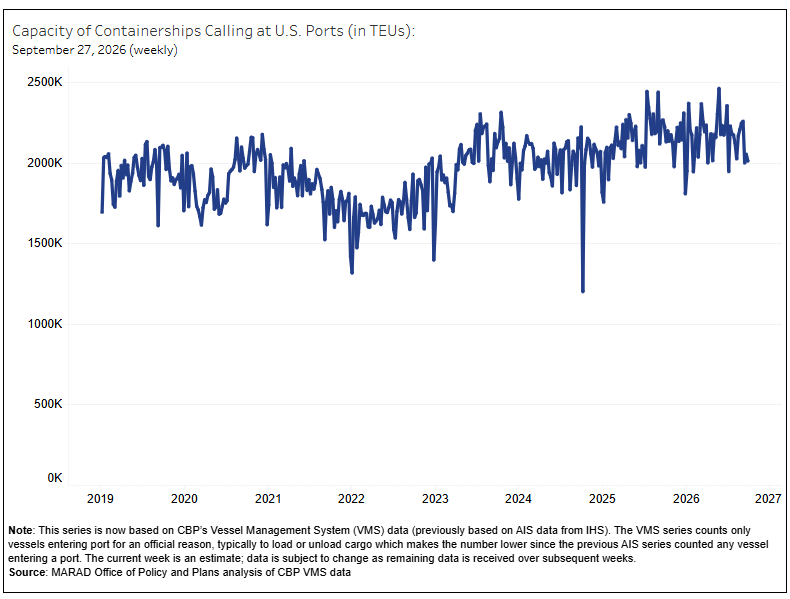
- Capacity of Containerships Calling at U.S. Ports
- Number of Containerships Anchored off U.S. Ports
- Number of Containerships Awaiting Berths at all U.S. Ports
- Average Train Speed
- Rail Cars Online
- Average Terminal Dwell Time
- Average Dwell Time at Major Terminals
- Average Dwell Time at Class I Railroad Terminals
- Rail Non-Intermodal Carloads
- Rail Intermodal Units
- Containers on Rail Flat Cars
- Trailers on a Rail Flat Car
- Job Openings and Labor Turnover for Transportation, Warehousing and Utilities
- Number of Truck Transportation Employees
- Warehousing and Storage Employees
- Rail Transportation Employees
- Freight Rates to Shanghai
- Freight Rates from Shanghai to LA
- Personal Consumption Expenditures of Durable Goods
- U.S. Goods Imports
- U.S. Diesel Sales Prices
- Downbound Grain Barge Rates
BTS began tracking supply chain indicators in 2020, at the direction of the White House. The Department of Transportation (DOT) convened this interagency working group, which includes relevant DOT modes and the U.S. Departments of Agriculture, Energy, Commerce and Labor.