
Transborder Freight Data Annual Report: 2025
BTS 26-47
This release is published on a fixed schedule as required by the Office of Management and Budget, and statistics in this release may be revised when inputs to the statistics are corrected or updated. Data on the program page of this website are the most up-to-date and complete.
Transborder data is available for 2025. The Bureau of Transportation Statistics has compiled the dollar value of commodities that moved across the United States’ land borders with Canada and Mexico by mode of transportation. Manufacturing and logistics sectors across North America are linked and interdependent. America’s land borders with Canada and Mexico are economically vital conduits for North American supply chains, with about $4.0 billion in daily cross-border freight shipments. In addition to oil and energy products, automobiles, and electronics, Canada and Mexico are also America’s largest trading partners in agricultural goods.
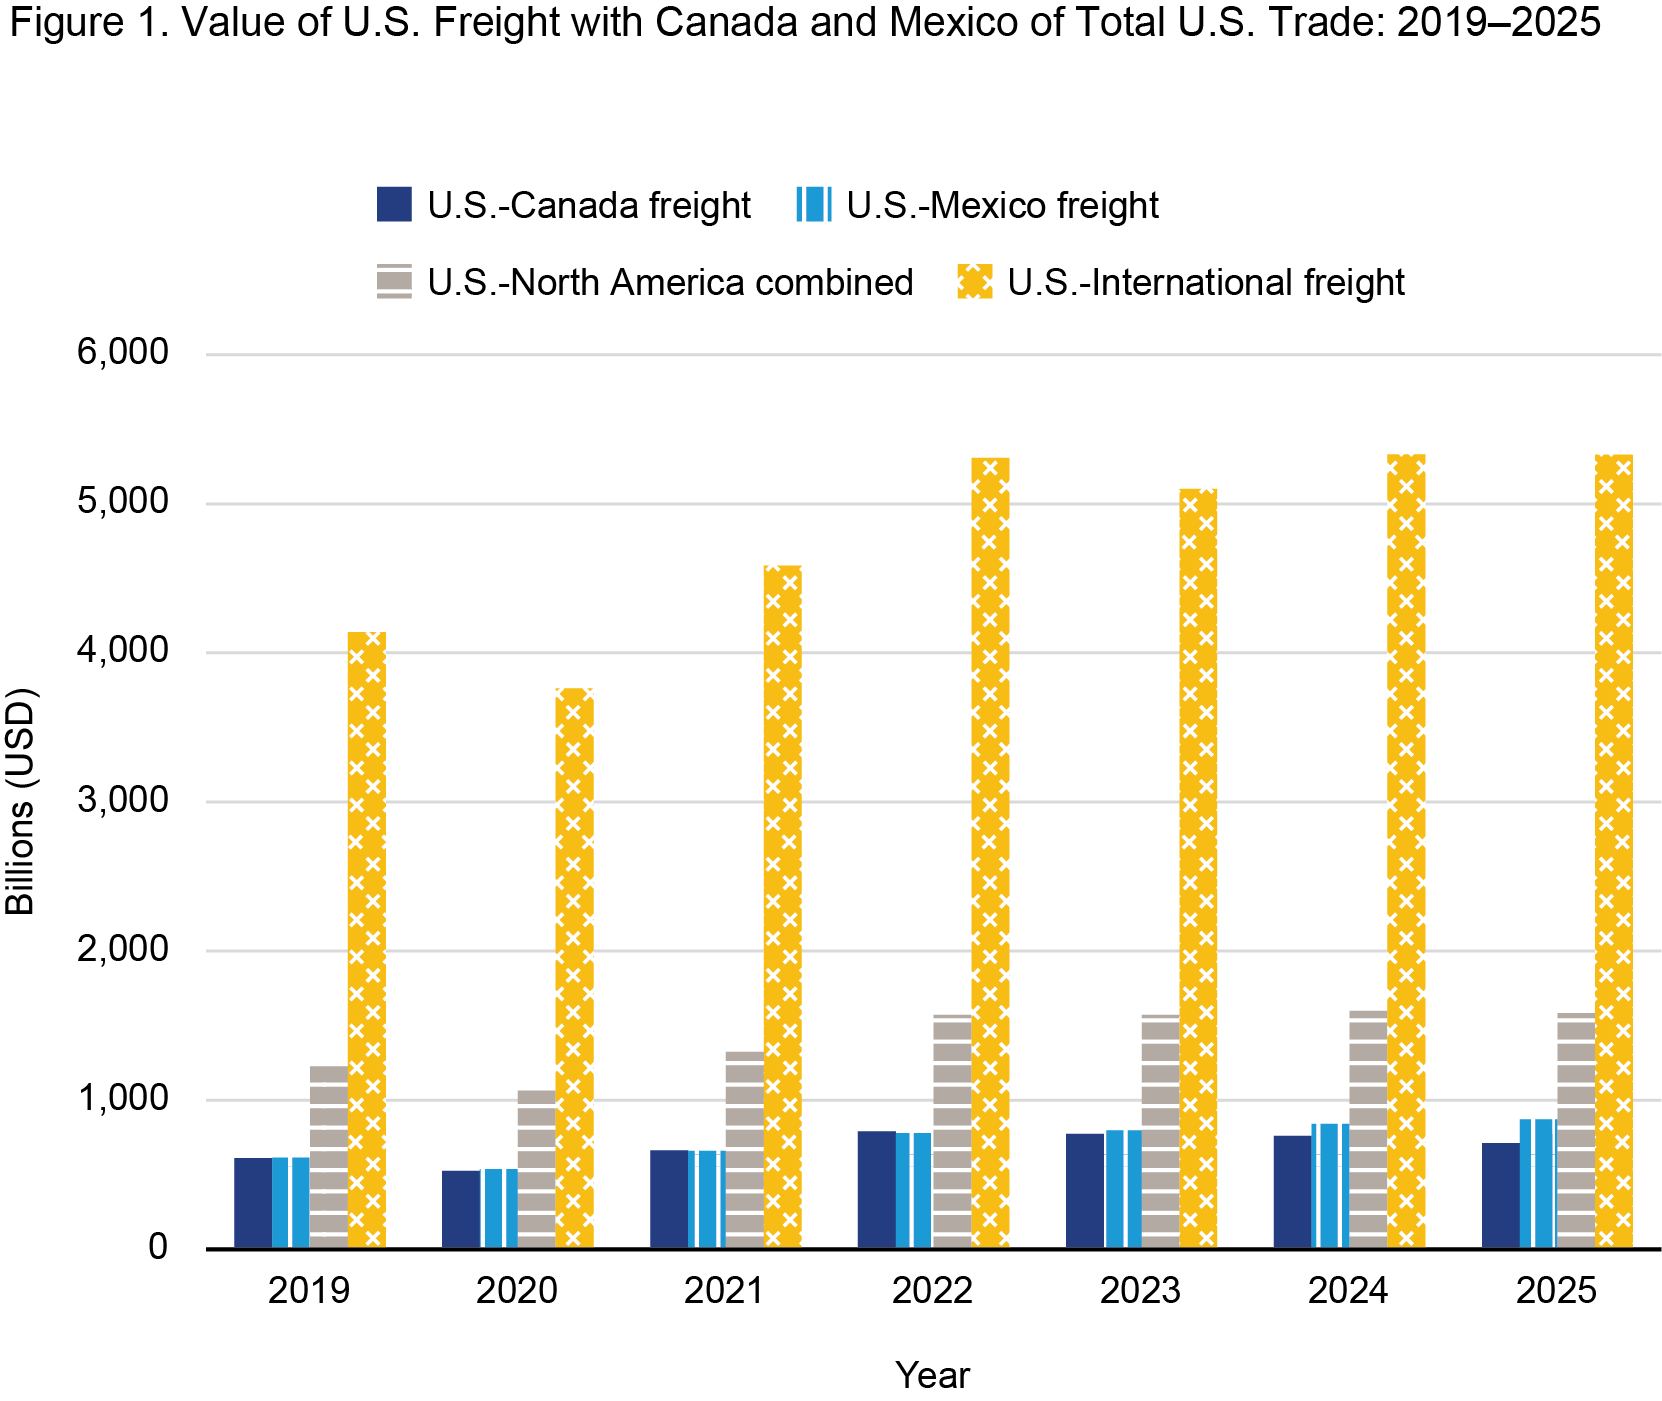
U.S. land borders with Canada and Mexico consistently facilitate over $1 trillion in cross-border trade annually. By comparison, in 2025 the value of total U.S.-international trade was $5.3 trillion, of which U.S. trade with Canada and Mexico comprised nearly one-third. In 2025, U.S. freight flows with Canada and Mexico equaled $1.6 trillion, a 1% decrease over 2024. Freight between the U.S. and Canada was $712.8 billion in 2025, down 6.4% from 2024. Freight between the U.S. and Mexico was $872.8 billion in 2025, up 3.9% from 2024.
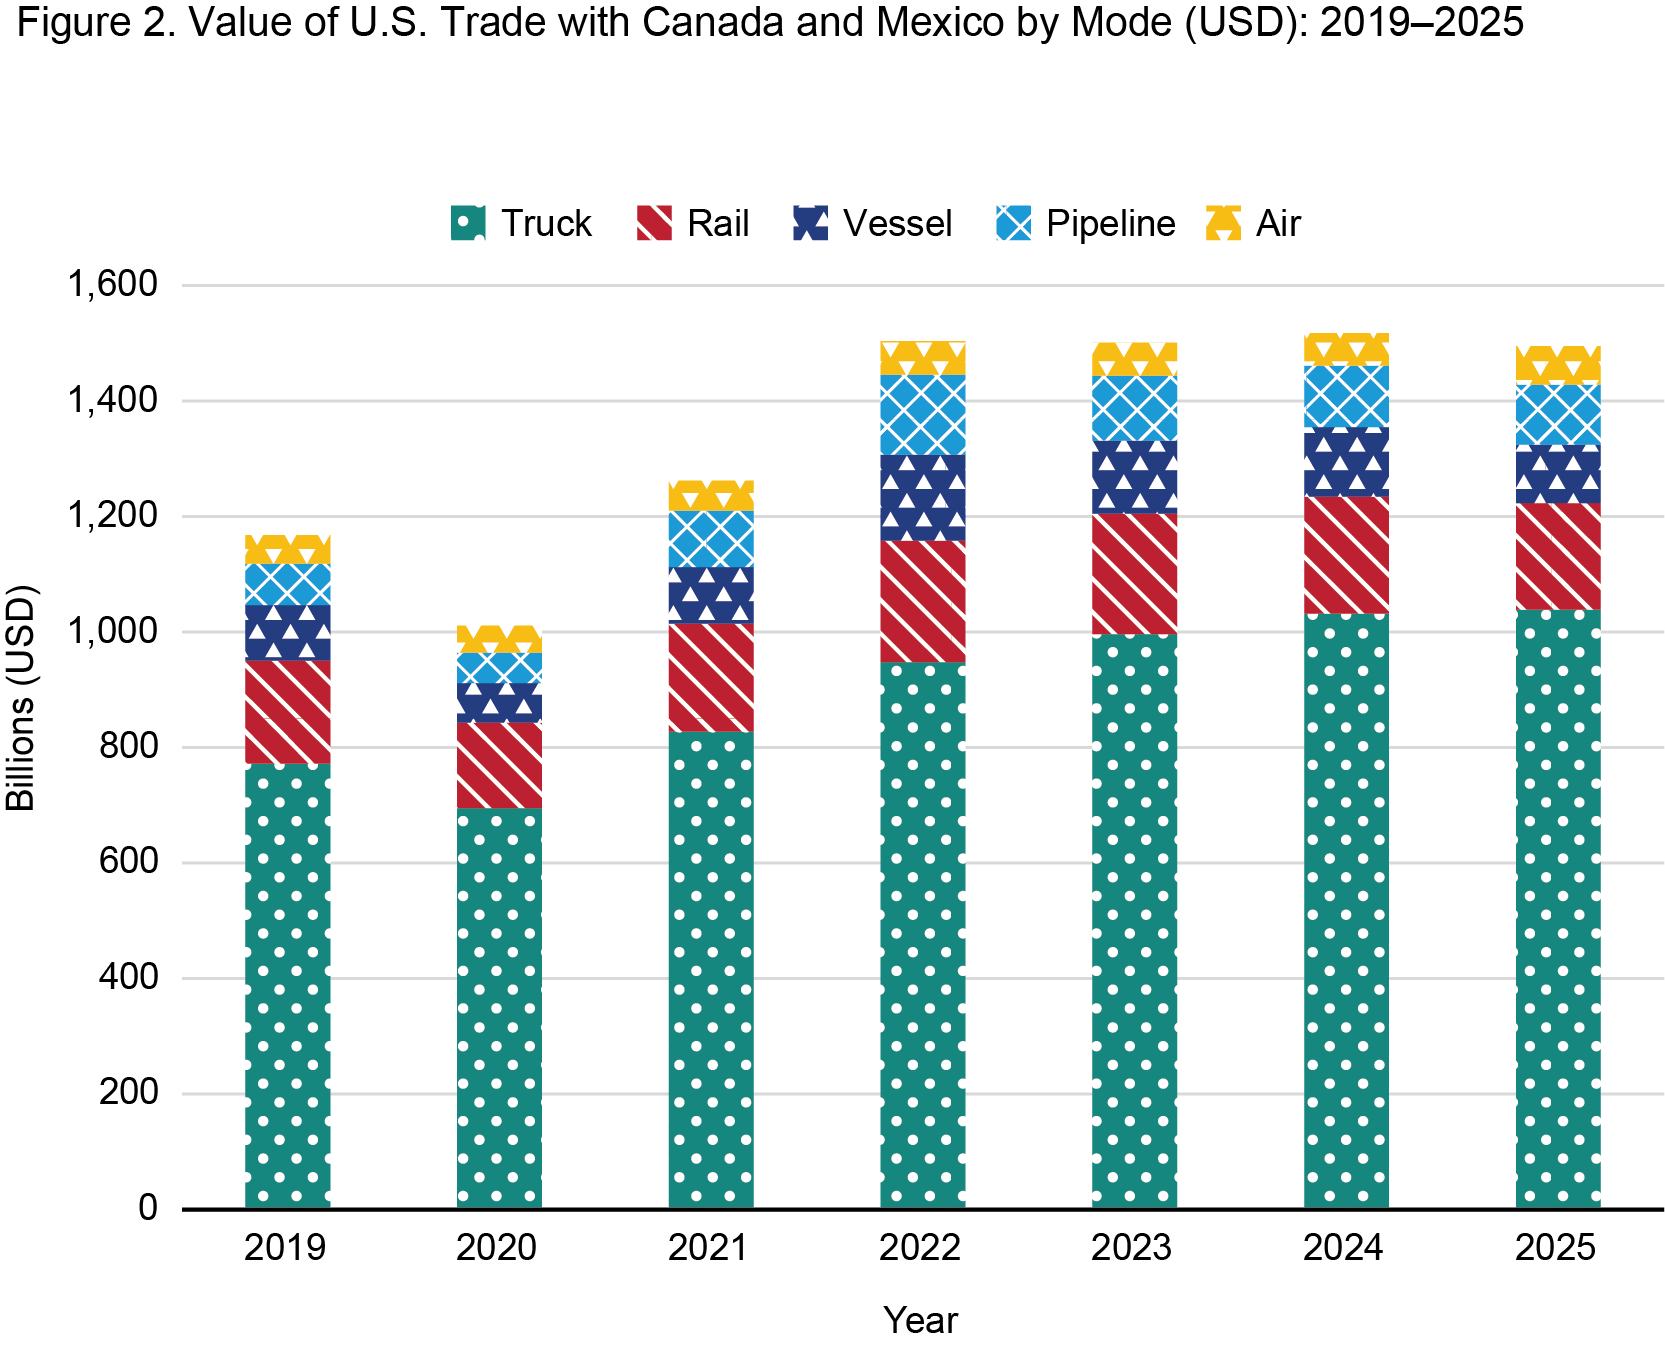
Surface transportation (truck + rail + pipeline) serves as the foundation of North American commerce, facilitating over 80% of all freight by value. Trucking remains the leader, carrying 55.7% of trade with Canada and 73.6% with Mexico. While rail remains vital across both borders, Canada’s modal profile is uniquely bolstered by pipeline shipments. In 2025, mineral fuels moved via pipeline ranked as the second-largest mode for U.S.-Canada trade at 13.4%, narrowly outpacing rail’s 12.6% share. Meanwhile, rail accounted for a consistent 10.9% of freight value with Mexico. All data in this report is sourced from BTS Transborder Freight Data.
(USD Millions)
| Month | 2021 | 2022 | 2023 | 2024 | 2025 |
|---|---|---|---|---|---|
| January | 94,284 | 113,707 | 125,783 | 124,177 | 134,404 |
| February | 95,860 | 112,459 | 119,919 | 128,916 | 131,635 |
| March | 114,587 | 141,850 | 141,472 | 133,540 | 144,802 |
| April | 107,369 | 135,255 | 126,573 | 137,996 | 126,331 |
| May | 108,646 | 139,439 | 136,241 | 138,924 | 132,098 |
| June | 115,955 | 141,238 | 134,795 | 134,299 | 131,038 |
| July | 111,270 | 132,559 | 127,052 | 134,156 | 132,625 |
| August | 113,075 | 140,339 | 138,015 | 136,726 | 130,986 |
| September | 109,220 | 133,934 | 131,816 | 136,271 | 130,608 |
| October | 117,417 | 133,756 | 138,501 | 138,889 | 138,427 |
| November | 120,094 | 125,826 | 131,020 | 130,976 | 124,832 |
| December | 117,548 | 121,668 | 121,586 | 126,292 | 127,808 |
| Annual | 1,325,325 | 1,572,031 | 1,572,774 | 1,601,091 | 1,585,594 |
(USD Actual)
| US. - Canada Freight by Mode | USD | Modal percent | U.S.-Mexico Freight by Mode | USD | Modal percent |
|---|---|---|---|---|---|
| Total | 712,761,384,216 | 100.0% | Total | 872,833,677,052 | 100.0% |
| Truck | 396,778,567,880 | 55.7% | Truck | 642,241,157,455 | 73.6% |
| Pipeline | 95,516,856,253 | 13.4% | Rail | 94,747,294,363 | 10.9% |
| Rail | 89,721,265,023 | 12.6% | Vessel | 67,376,202,548 | 7.7% |
| Other (including unknown) | 59,464,488,628 | 8.3% | Air | 33,151,546,895 | 3.8% |
| Vessel | 33,982,052,897 | 4.8% | Other (including unknown | 16,662,931,749 | 1.9% |
| Air | 32,936,863,682 | 4.6% | Imports into Foreign Trade Zones | 10,224,659,090 | 1.2% |
| Imports into Foreign Trade Zones | 4,334,798,641 | 0.6% | Pipeline | 8,428,410,260 | 1.0% |
| 26,531,212 | 0.0% | 1,474,692 | 0.0% |
(USD Actual)
| Year | U.S. - Canada Freight | U.S. - Mexico Freight | U.S. - North America Combined | U.S. - Int'l Freight | North America of Total |
|---|---|---|---|---|---|
| 2019 | 612,117,585,003 | 614,500,090,695 | 1,226,617,675,698 | 4,137,639,906,375 | 29.6% |
| 2020 | 525,531,097,628 | 538,066,059,696 | 1,063,597,157,324 | 3,761,472,584,841 | 28.3% |
| 2021 | 664,160,506,749 | 661,164,319,325 | 1,325,324,826,074 | 4,586,259,225,321 | 28.9% |
| 2022 | 792,722,458,974 | 779,307,814,494 | 1,572,030,273,468 | 5,306,326,672,111 | 29.6% |
| 2023 | 773,938,974,684 | 798,834,655,096 | 1,572,733,629,780 | 5,098,229,579,346 | 30.8% |
| 2024 | 761,199,136,085 | 839,891,957,628 | 1,601,091,093,713 | 5,331,905,478,186 | 30.0% |
| 2025 | 712,761,384,216 | 872,833,677,052 | 1,585,595,061,268 | 5,328,100,952,922 | 29.8% |
U.S.-North American Freight Points
- Total transborder freight: $1.6 trillion of transborder freight moved by all modes of transportation, a 1.0% decrease compared to 2024
- Freight between the U.S. and Canada: $712.8 billion, down 6.4% from 2024
- Freight between the U.S. and Mexico: $872.8 billion, up 3.9% from 2024
- Trucks moved $1.0 trillion of freight, up 0.7% compared to 2024
- Railways moved $184.5 billion of freight, down 9.2% compared to 2024
- Pipelines moved $103.9 billion of freight, down 2.5% compared to 2024
- Vessels moved $101.4 billion of freight, down 15.6% compared to 2024
- Air moved $66.1 billion of freight, up 17.7% compared to 2024
- Vessel and pipeline freight decreased due to the lower dollar value of mineral fuels
(USD Actual)
| Year | Truck | Rail | Vessel | Pipeline | Air |
|---|---|---|---|---|---|
| 2019 | 772,274,268,505 | 178,568,732,116 | 95,523,364,930 | 72,409,907,762 | 49,519,058,644 |
| 2020 | 694,693,309,634 | 148,418,611,708 | 68,600,505,847 | 53,112,729,713 | 46,491,982,077 |
| 2021 | 827,888,755,145 | 186,458,517,677 | 98,217,981,501 | 97,416,823,777 | 52,734,341,357 |
| 2022 | 947,927,139,823 | 210,230,072,464 | 149,157,667,344 | 138,833,746,385 | 57,845,793,466 |
| 2023 | 996,351,902,663 | 209,224,473,453 | 126,315,411,102 | 112,562,939,123 | 57,140,251,792 |
| 2024 | 1,031,807,657,234 | 203,093,372,593 | 120,096,999,933 | 106,604,355,085 | 56,146,010,261 |
| 2025 | 1,039,019,725,335 | 184,468,559,386 | 101,358,255,445 | 103,945,266,513 | 66,088,410,577 |
In many ways, America’s geographic position in North America is a tale of two borders: energy from the north and manufacturing from the south. Transborder freight activity data reveals two different trade profiles that keep the U.S. economy running. The U.S.-Canada relationship is defined by energy and natural resources, with pipelines and rail moving large volumes of fuel and timber. Conversely, the U.S.-Mexico relationship is defined by its manufacturing and labor dominance, with finished goods moving by truck. This dual-profile trade strategy provides North American supply chains with stability and diversification.
| Top 10 Ports | % Export | % Import | % of Total | Value ($M) | YOY Change |
|---|---|---|---|---|---|
| Detroit - Michigan | 57.8 | 42.2 | 23.7% | 94,175,491,991 | -17.5% |
| Port Huron - Michigan | 48.9 | 51.1 | 22.0% | 87,332,134,629 | 11.3% |
| Buffalo - Niagara Falls - New York | 53.2 | 46.8 | 17.7% | 70,076,028,739 | -3.1% |
| Pembina - North Dakota | 59.9 | 40.1 | 5.4% | 21,336,936,148 | -11.5% |
| Champlain - Rouses Point - New York | 40.1 | 59.9 | 5.1% | 20,248,934,993 | -9.1% |
| Blaine - Washington | 53.6 | 46.4 | 4.7% | 18,532,910,439 | -7.2% |
| Alexandria Bay - New York | 44.9 | 55.1 | 3.6% | 14,321,479,018 | -18.5% |
| Sweetgrass - Montana | 48.0 | 52.0 | 3.6% | 14,181,882,909 | -6.1% |
| Portal - North Dakota | 69.1 | 30.9 | 3.1% | 12,441,987,689 | -6.1% |
| Highgate Springs/ Alburg - Vermont | 28.7 | 71.3 | 1.0% | 4,154,001,438 | -4.7% |
| Top 10 Truck Commodities | % Export | % Import | % of Total | Value ($M) | YOY Change |
|---|---|---|---|---|---|
| Computer-Related Machinery and Parts | 60.2 | 39.8 | 16.9% | 67,040,488,225 | -4.0% |
| Vehicles Other than Railway | 51.4 | 48.9 | 13.2% | 52,226,677,856 | -11.2% |
| Electrical Machinery Equipment and Parts | 67.6 | 32.4 | 7.2% | 28,450,418,556 | -5.1% |
| Special Classification Provisions | 23.9 | 76.1 | 4.8% | 19,099,444,970 | -4.3% |
| Plastics and Articles | 50.8 | 49.2 | 4.8% | 18,925,797,886 | -8.6% |
| Pearls; Stones; Metals and Imitation Jewelry | 42.4 | 57.6 | 4.1% | 16,269,492,246 | 24.0% |
| Pharmaceutical Products | 64.4 | 35.6 | 2.4% | 9,665,353,285 | -11.9% |
| Paper and Paperboard | 43.6 | 56.4 | 2.4% | 9,651,194,313 | -8.0% |
| Preparations of Cereals and Flour | 30.8 | 69.2 | 2.4% | 9,424,615,117 | -3.8% |
| Measuring and Testing Instruments | 67.9 | 32.1 | 2.3% | 9,012,512,372 | -4.6% |
| Top 10 Ports | % Export | % Import | % of Total | Value ($M) | YOY Change |
|---|---|---|---|---|---|
| Laredo | 35.3 | 64.7 | 46.1% | 296,244,922,829 | 5.1% |
| Ysleta Port of Entry | 34.4 | 65.6 | 17.5% | 112,399,054,531 | 34.8% |
| Otay Mesa - California | 35.3 | 64.7 | 9.1% | 58,620,229,904 | -3.8% |
| Hidalgo - Texas | 29.6 | 70.4 | 6.3% | 40,756,498,670 | -4.3% |
| Santa Teresa - New Mexico | 35.3 | 64.7 | 5.1% | 33,021,537,321 | -14.9% |
| Nogales - Arizona | 34.4 | 65.6 | 4.0% | 25,427,405,680 | 1.5% |
| Calexico - East California | 40.7 | 59.3 | 3.1% | 19,782,928,928 | -9.7% |
| Brownsville - Texas | 48.7 | 51.3 | 2.3% | 14,947,476,225 | -6.5% |
| El Paso - Texas | 76.5 | 23.5 | 1.9% | 12,070,197,482 | 16.1% |
| Eagle Pass - Texas | 42.2 | 57.8 | 1.6% | 10,191,331,156 | -7.3% |
| Top 10 Truck Commodities | % Export | % Import | % of Total | Value ($M) | YOY Change |
|---|---|---|---|---|---|
| Computer-Related Machinery and Parts | 27.4 | 72.6 | 29.4% | 189,115,884,089 | 31.2% |
| Electrical Machinery; Equipment and Parts | 37.8 | 62.2 | 21.3% | 136,851,006,961 | 2.7% |
| Vehicles Other than Railway | 23.2 | 76.8 | 12.0% | 77,307,194,186 | -9.2% |
| Measuring and Testing Instruments | 30.0 | 70.0 | 5.0% | 31,824,349,129 | 0.6% |
| Plastics and Articles | 70.4 | 29.6 | 3.9% | 25,221,556,068 | -0.6% |
| Furniture; Lamps and Prefabricated Buildings | 12.9 | 87.1 | 2.1% | 13,650,768,737 | -3.6% |
| Articles of Iron and Steel | 56.6 | 43.4 | 1.9% | 12,252,183,392 | -12.1% |
| Edible Fruit and Nuts | 12.0 | 88.0 | 1.8% | 11,262,454,584 | -6.2% |
| Special Classification Provisions | 1.8 | 98.2 | 1.4% | 9,211,724,101 | 21.6% |
| Edible Vegetables and Roots | 5.3 | 94.7 | 1.3% | 8,488,392,319 | -18.9% |
U.S.-Canada Data Points
- Detroit, Port Huron, and Buffalo are the top truck ports for U.S. freight flows with Canada.
- Detroit, Port Huron, and International Falls are the top rail connection ports for U.S. freight flows with Canada.
- Chicago, Port Huron, and Minneapolis are the top pipeline connection regions for U.S. energy freight flows with Canada.
- Port of Boston, Arthur, and Portland are the top water port connections for U.S. energy flows with Canada.
U.S.-Mexico Data Points
- Laredo, Ysleta, and Otay Mesa are the top truck ports with Mexico.
- Laredo, Eagle Pass, and El Paso are the top rail connection ports with Mexico.
- El Paso, Hidalgo, and Laredo are the top pipeline connection regions with Mexico.
- Port of Houston, Arthur, and Texas City are the top water port connections for U.S. energy flows on the Southern border.
- Energy flows by vessel with Mexico are more expansive than pipeline flows with Canada.
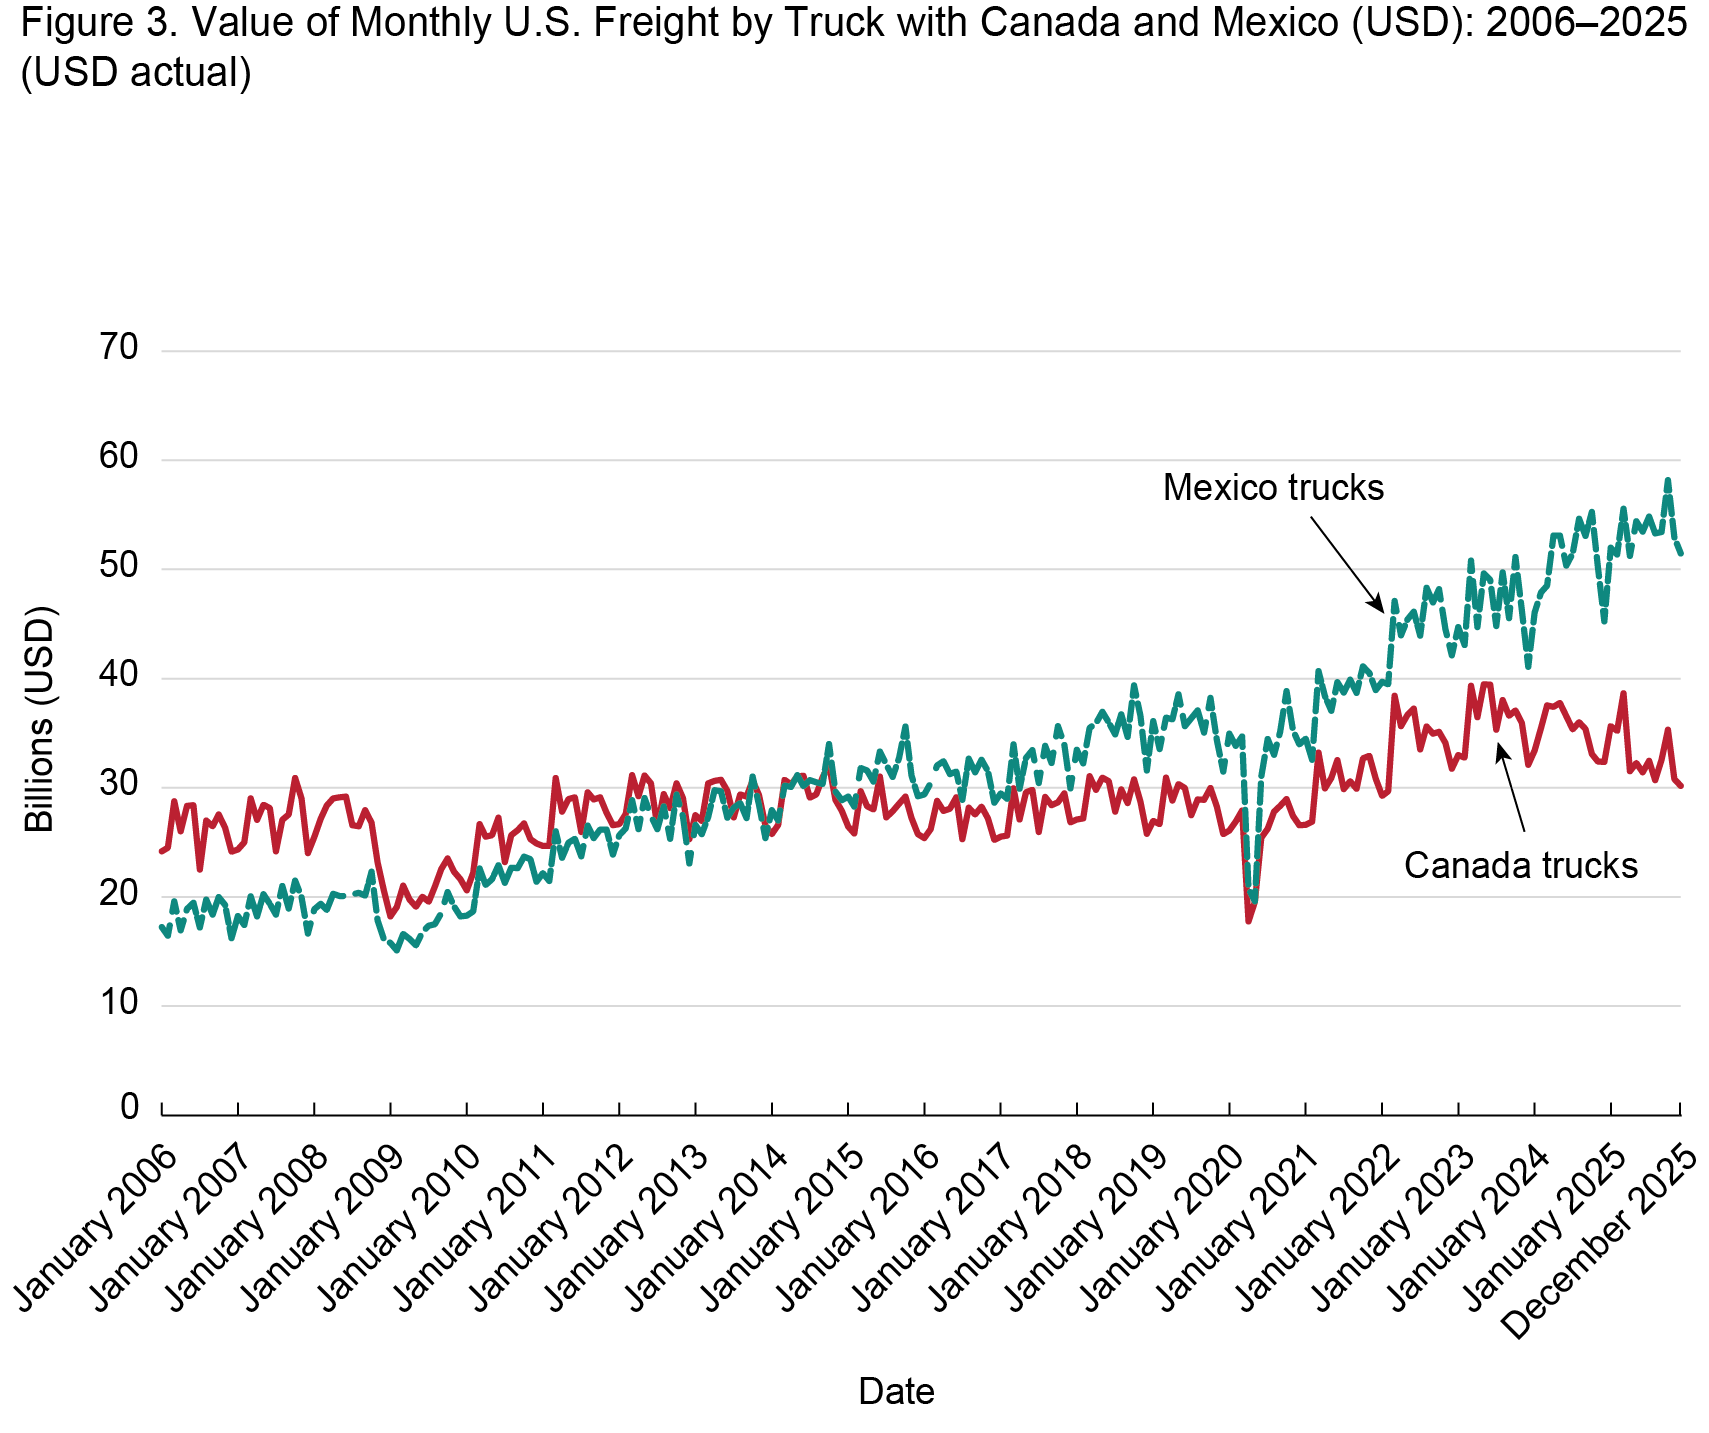
The value of freight shipments by truck with Canada and Mexico reveals another emerging long-term trend. Historically, Canada was the dominant trucking partner. However, around 2015, the two lines began to converge. Starting in 2015, there have been several periods where U.S. freight with Mexico by value has surpassed that of Canada. Shipments from Mexico by truck have accelerated, highlighting Mexico's growing role as the primary manufacturing hub south of the border. From the pandemic lows in April 2020 to December 2025, freight by truck with Canada has increased from $17.8 billion to $30.2 billion while freight by truck with Mexico has grown from $20.8 billion to $51.5 billion. Mexico’s trucking trade value is now roughly 50% higher than Canada's. This likely reflects broader economic trends such as "nearshoring," where manufacturing has shifted from Asia to Mexico to be closer to the U.S. market.
Border Resiliency
The border resiliency data provide an assessment of U.S. land borders, prioritizing gateway resiliency and redundancy. By analyzing freight values and crossing volumes, a binational working group identified high-consequence ports vulnerable to supply chain disruptions. This collaboration establishes a joint risk-measurement framework designed to mitigate bottlenecks and ensure a more secure, resilient border for U.S.-North America freight transportation.
The Port of Laredo, Texas, remains the premier gateway for North American trade, facilitating over $296.2 billion in annual freight. Laredo alone handles almost 6 million truck crossings annually. From a resiliency perspective, the corridor’s stability is bolstered by its proximity to Colombia-Solidarity, which serves as a critical alternative crossing just 20 miles away. Similarly, in the north, the Detroit-Windsor crossing remains the vital artery for the automotive industry, handling $94.2 billion in trade with Port Huron serving as its primary 65-mile resiliency partner. The completion of the new Gordie Howe International Bridge is set to provide a critical redundancy in the Detroit-Windsor corridor, significantly enhancing freight resiliency by offering a modern, high-capacity alternative that reduces congestion and alleviates the safety risks associated with aging infrastructure.
Key Resiliency Points
- The Laredo Congestion Point: Laredo, TX is the most critical land port in North America, handling nearly $300B in trade--the busiest land port for trade value and truck volume, consistently reaching high risk levels for congestion. While Colombia-Solidarity is an alternative, it is only 20 miles away, meaning a major regional disruption (like the 2024 supply chain shifts or labor strikes) would likely saturate the entire corridor.
- The Detroit-Port Huron Corridor: The Detroit/Port Huron corridor has a significant 65-mile gap to the next nearest crossing, which contributes to the "High" risk rating during disruptions. These two Michigan ports act as each other's primary relief valves. However, at 65 miles apart and with specific infrastructure (bridges vs. tunnels), they require significant coordination for true resiliency during an outage.
- Southern Border Imports: Crossings like Hidalgo, TX and Nogales, AZ are heavily weighted toward imports (70% and 65% respectively), primarily driven by the "just-in-time" fresh produce and automotive supply chains from Mexico. Mexico crossings average significantly higher wait times (approx. 40 mins) compared to Canadian crossings (approx. 22 mins) due to higher inspection densities.
- Northern Redundancy: Buffalo and Niagara have a relatively short relief distance of 36 miles, making this one of the more resilient segments of the Northern border compared to remote ports like Pembina, ND.
| Port Name | Risk Level | Export (%) | Import (%) | Share of Corridor (%) | Total Trade Value (USD) | Truck Crossings | Rail Crossings |
|---|---|---|---|---|---|---|---|
| Detroit - Michigan | HIGH | 55.7 | 44.3 | 0.1765 | 125,810,318,941 | 1,132,176 | 94,800 |
| Port Huron - Michigan | HIGH | 46.8 | 53.2 | 0.1636 | 116,609,296,011 | 916,222 | 80,200 |
| Buffalo - New York | HIGH | 48.7 | 51.3 | 0.1107 | 78,906,031,974 | 865,370 | 52,400 |
| Chicago Customs District | MOD | 0.1 | 99.9 | 0.0564 | 40,172,651,901 | 626,800 | 23,400 |
| Pembina - North Dakota | MOD | 60.2 | 39.8 | 0.0447 | 31,867,846,862 | 269,604 | 16,800 |
| Champlain - New York | MOD | 39.2 | 60.8 | 0.032 | 22,834,704,180 | 330,536 | 4,400 |
| Blaine - Washington | MOD | 48.6 | 51.4 | 0.0315 | 22,459,759,240 | 580,210 | 15,600 |
| Portal - North Dakota | MOD | 58.2 | 41.8 | 0.0259 | 18,435,193,936 | 286,200 | 5,800 |
| Sweetgrass - Montana | LOW | 42.7 | 57.3 | 0.025 | 17,808,449,201 | 251,200 | 13,400 |
| Alexandria Bay - New York | LOW | 44.9 | 55.1 | 0.0201 | 14,331,702,782 | 178,200 | - |
| Port Name | Risk Level | Personal Vehicle Crossings | CBP Officers | Nearest Alt Crossing (mi) | Nearest Alt Crossing Name | Avg Truck Wait (min) | Top Commodity |
|---|---|---|---|---|---|---|---|
| Detroit - Michigan | HIGH | 3,468,294 | 412 | 60 | Blue Water Bridge | 24 | Auto Parts |
| Port Huron - Michigan | HIGH | 822,138 | 380 | 60 | Ambassador Bridge | 16 | Machinery |
| Buffalo - New York | HIGH | 3,678,378 | 298 | 36 | Lewiston-Queenston Bridge | 32 | Food Products |
| Chicago Customs District | MOD | 202,400 | 110 | 20 | Regional Hub / Detroit | 13 | Petroleum / Grain |
| Pembina - North Dakota | MOD | 888,340 | 94 | 5 | Emerson - Pembina | 10 | Lumber / Paper Products |
| Champlain - New York | MOD | 2,433,220 | 84 | 13 | Overton Corners - Lacolle | 17 | Consumer Goods / Agriculture |
| Blaine - Washington | MOD | 1,980,550 | 245 | 12 | Lynden - Aldergrove | 28 | Wood / Produce |
| Portal - North Dakota | MOD | 112,800 | 64 | 48 | Northgate | 7 | Petroleum / Agriculture |
| Sweetgrass - Montana | LOW | 61,600 | 55 | 23 | Coutts | 6 | Potash / Grain |
| Alexandria Bay - New York | LOW | 296,600 | 40 | 12 | Thousand Islands Bridge | 5 | Dairy / Forest Products |
Note: Colors indicate risk levels: red is HIGH risk, yellow is MODERATE risk, and green is LOW risk.
Risk is determined by the port's share of the bilateral trade corridor and distance to the nearest viable alternate crossing.
| Port Name | Risk Level | Exports (%) | Imports (%) | Share of Corridor (%) | Total Trade Value (USD) | Truck Crossings | Rail Crossings |
|---|---|---|---|---|---|---|---|
| Laredo - Texas | HIGH | 36.8 | 63.2 | 0.3948 | 344,553,742,638 | 2,850,400 | 290,100 |
| Ysleta - Texas | HIGH | 34.4 | 65.6 | 0.1288 | 112,402,976,156 | 956,000 | 79,200 |
| Otay Mesa - California | HIGH | 35.8 | 64.2 | 0.0687 | 59,978,979,505 | 1,210,500 | - |
| El Paso - Texas | MOD | 52.3 | 47.7 | 0.0308 | 26,858,467,552 | 980,600 | 115,200 |
| Eagle Pass - Texas | MOD | 27.9 | 72.1 | 0.0496 | 43,254,375,811 | 245,000 | 185,400 |
| Hidalgo - Texas | MOD | 33.3 | 66.7 | 0.0494 | 43,131,075,577 | 720,300 | - |
| Nogales - Arizona | MOD | 33.2 | 66.8 | 0.0386 | 33,724,079,626 | 848,600 | 46,400 |
| Brownsville - Texas | MOD | 56.1 | 43.9 | 0.022 | 19,240,098,228 | 311,600 | 21,600 |
| Santa Teresa - New Mexico | LOW | 34.9 | 65.1 | 0.0382 | 33,380,152,806 | 775,600 | 21,600 |
| Calexico - East - California | LOW | 41.2 | 58.8 | 0.0229 | 20,021,838,524 | 582,400 | 21,600 |
| Port Name | Risk Level | Personal Vehicle Crossing | CBP Officers | Nearest Alt Crossing (mi) | Nearest Alt Crossing Name | Avg Truck Wait (min) | Top Commodity |
|---|---|---|---|---|---|---|---|
| Laredo - Texas | HIGH | 4,120,000 | 840 | 20 | Colombia Solidarity in Bridge | 45 | Vehicle Parts/ Machinery |
| Ysleta - Texas | HIGH | 7,784,755 | 508 | 12 | Bridge of the Americas | 56 | Electrical Equip./ Auto Parts |
| Otay Mesa - California | HIGH | 5,800,000 | 510 | 7 | San Ysidro | 55 | Auto Parts / Medical Supplies |
| El Paso - Texas | MOD | 8,240,000 | 620 | 10 | Ysleta - Zaragoza | 40 | Auto Parts / Electrical Equip. |
| Eagle Pass - Texas | MOD | 1,850,000 | 210 | 55 | Laredo - World Trade Bridge | 22 | Steel / Auto |
| Hidalgo - Texas | MOD | 4,950,200 | 380 | 10 | Pharr - Reynosa Bridge | 38 | Produce |
| Nogales - Arizona | MOD | 460,200 | 182 | 15 | Mariposa Port of Entry | 23 | Auto Parts / Agriculture |
| Brownsville - Texas | MOD | 840,000 | 108 | 55 | Veterans Intl Bridge | 47 | Coal / Automotive |
| Santa Teresa - New Mexico | LOW | 4,914,000 | 168 | 5 | El Paso Port of Entry | 43 | Produce / Beverages |
| Calexico - East - California | LOW | 2,075,000 | 124 | 20 | Calexico - West | 39 | Steel / Agriculture |
Risk Level Legend:
| HIGH Risk | MODERATE Risk | LOW Risk |
Note: Colors indicate risk levels: red is HIGH risk, yellow is MODERATE risk, and green is LOW risk.
Risk is determined by the port's share of the bilateral trade corridor and distance to the nearest viable alternate crossing.
Truck crossing data reflect estimates of bidirectional counts, as CBP does not collect comparable outbound data. Rail crossings reflect loaded car equivalents. CBP Officers reflects authorized FY2025 positions. Avg Truck Wait (min) reflects peak-hour estimates from CBP WAIT app data, 2025.
Sources:
Bureau of Transportation Statistics, Border Crossing/Entry Data
Bureau of Transportation Statistics, TransBorder Freight Data
U.S. Customs and Border Protection, Trade Statistics and Port Wait Times
To receive updates from BTS directly to your email, please consider subscribing to our GovDelivery service.