
Transportation Consumer Price Index – August 2025
Today, the Bureau of Transportation Statistics (BTS) released the change in the costs faced by consumers for transportation goods and services, from August 2024 to August 2025, as measured by the Consumer Price Index (CPI). The annual change in CPI is a measure of inflation.
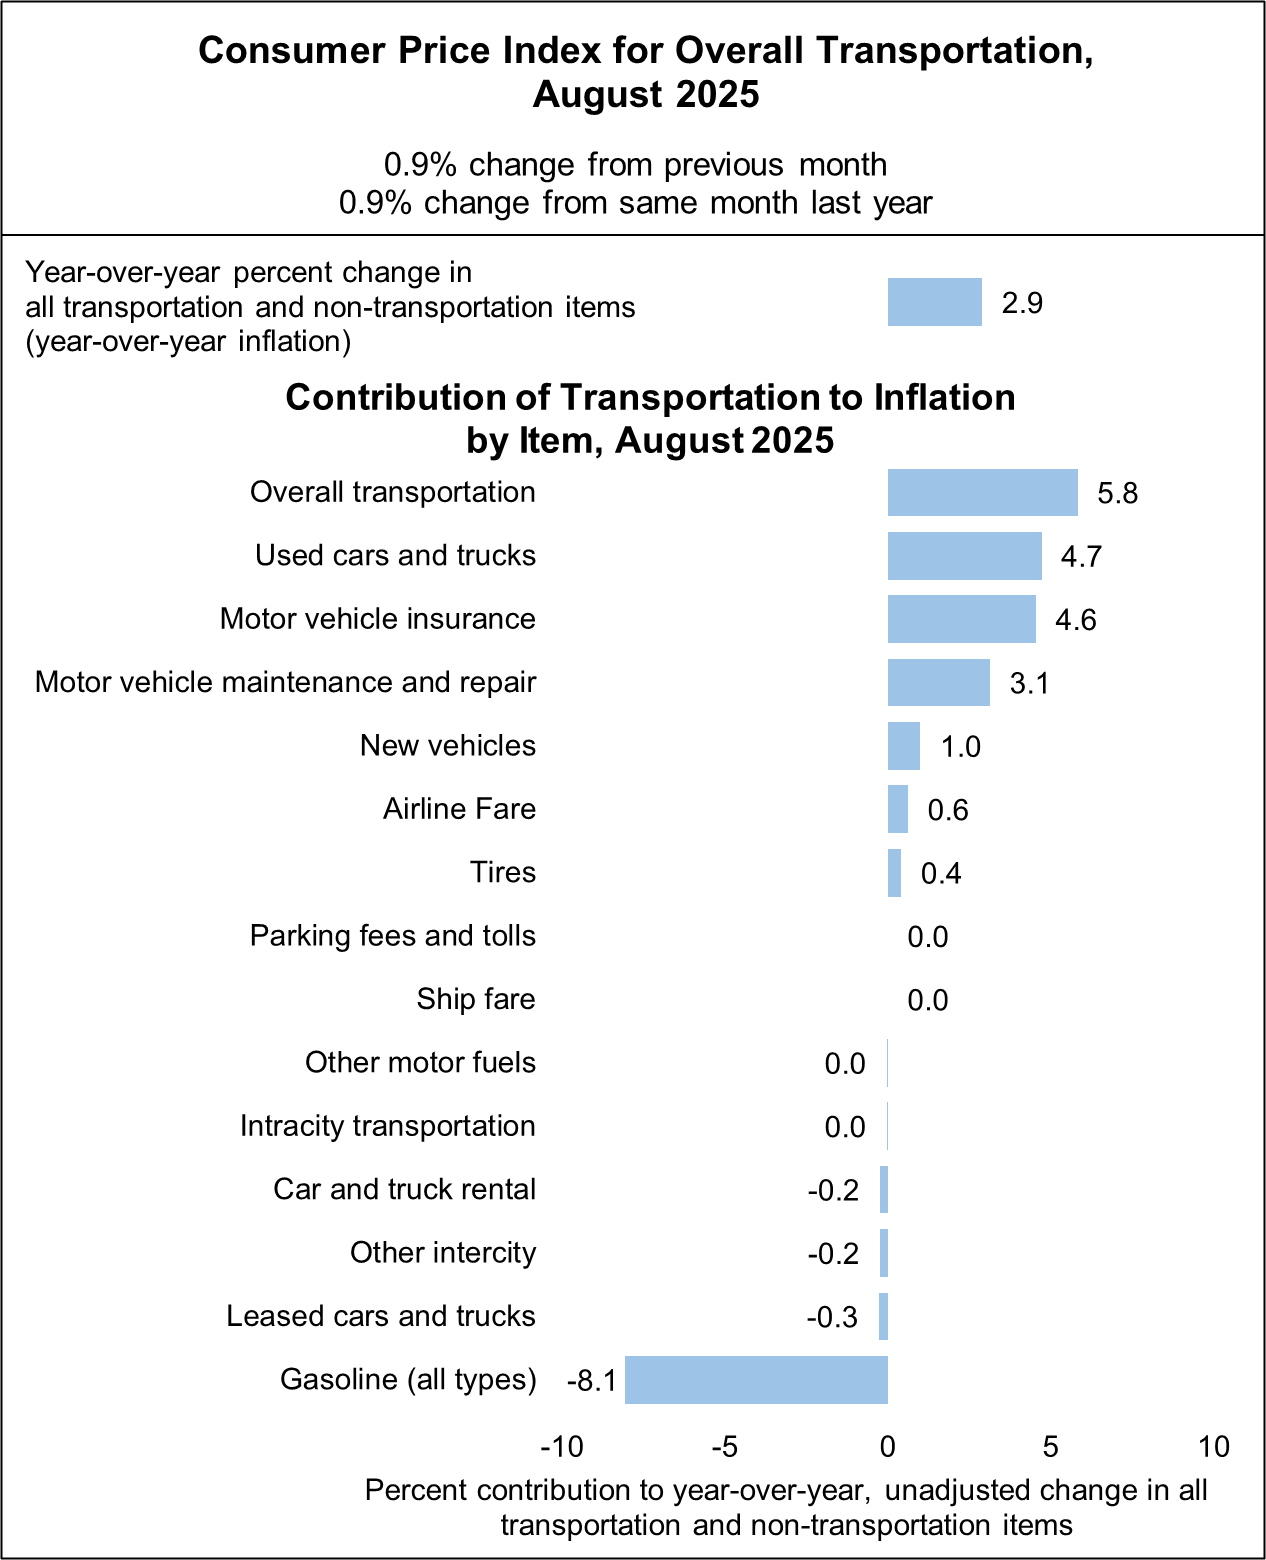
The CPI for all transportation goods and services rose 0.9% from August 2024 to August 2025. Transportation contributed 5.8% to the 2.9% increase in the price of all goods and services, per the CPI. Used cars and trucks contributed the most to inflation, rising 6.0% year-over-year and contributing 4.7% to the annual change in the price of all goods and services. By item, the top three contributors to inflation in August 2025 were:
- Used cars and trucks: +4.7%
- Motor vehicle insurance: +4.6%
- Motor vehicle maintenance and repair: +3.1%
The top three items dampening transportation’s contribution to inflation in August 2025 were:
- Gasoline (all types): -8.1%
- Leased cars and trucks: -0.3%
- Other intercity (ship, bus, and train) fares: -0.2%
- Car and truck rental (tied for 3rd): -0.2%
For additional information and for interactive charts on transportation's role in the economy and changes (trends) over time, please visit BTS’ Transportation Economic Trends.
To receive updates from BTS directly to your email, please consider subscribing to our GovDelivery service.