USA Banner

Official US Government Icon

Official websites use .gov
A .gov website belongs to an official government organization in the United States.

Secure Site Icon

Secure .gov websites use HTTPS
A lock ( ) or https:// means you’ve safely connected to the .gov website. Share sensitive information only on official, secure websites.

U.S. Department of Transportation U.S. Department of Transportation Icon United States Department of Transportation United States Department of Transportation

Transportation Consumer Price Index – February 2026

Wednesday, March 11, 2026

BTS 26-25

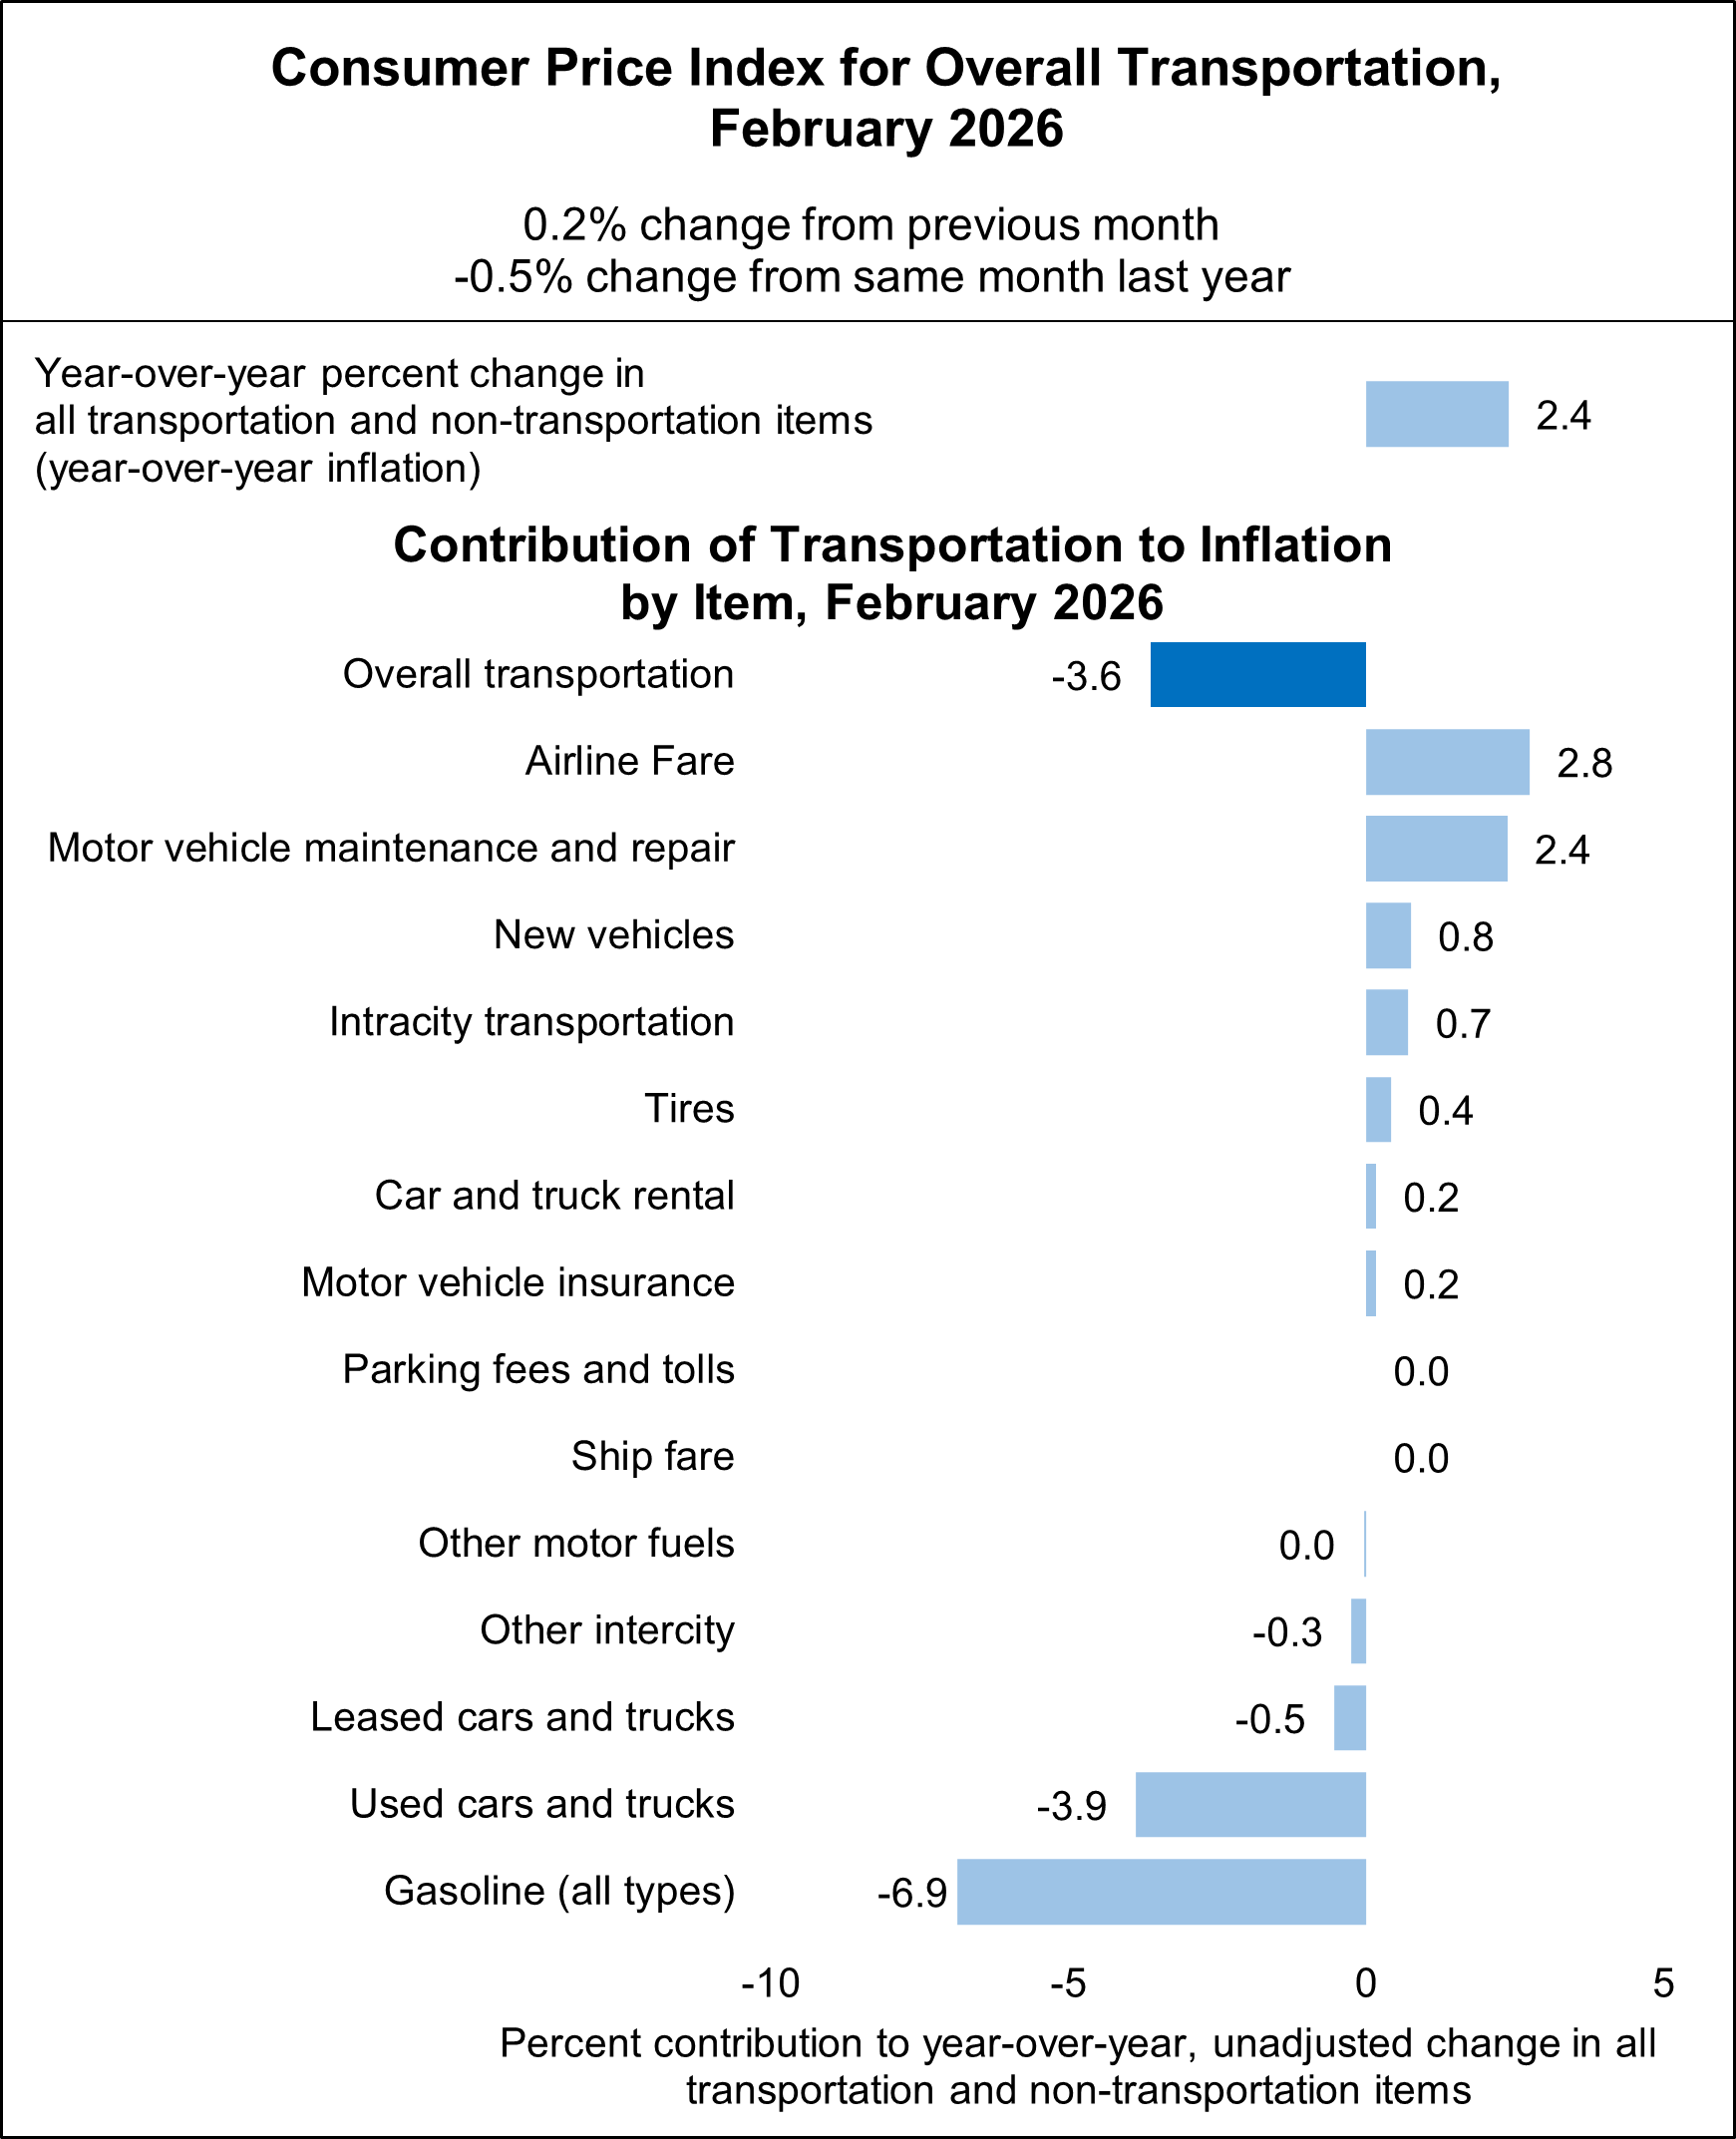
Today, the Bureau of Transportation Statistics (BTS) released the change in the costs faced by consumers for transportation goods and services, from February 2025 to February 2026, as measured by the Consumer Price Index (CPI). The annual change in CPI is a measure of inflation.

The CPI for all transportation goods and services fell 0.5% from February 2025 to February 2026. Transportation dampened the 2.4% increase in the price of all goods and services by 3.6%, per the CPI. Airline fare contributed the most to inflation, rising 7.1% year-over-year and contributing 2.8% to the annual change in the price of all goods and services. By item, the top three contributors to inflation in February 2026 were:

  • Airline Fare: +2.8%
  • Motor vehicle maintenance and repair: +2.4%
  • New vehicles: +0.8%

The top three items dampening transportation’s contribution to inflation in February 2026 were:

  • Gasoline (all types): -6.9%
  • Used cars and trucks: -3.9%
  • Leased cars and trucks: -0.5%
The figure is a bar chart showing the year-over-year change in the Consumer Price Index (CPI) from February 2025 to February 2026, along with transportation's contribution to the overall change in the CPI by item. The overall CPI increased 2.5% from February 2025 to 2026 and transportation dampened the growth by 3.6% over the time period. The bar chart shows which transportation items contributed to or dampened the overall CPI growth. Items contributing most to the growth have a value greater than zero and are listed first while items dampening the growth have a value less than zero and are listed at the bottom. Airline fare is the first item and contributed 2.8% to the overall growth in the CPI, followed by motor vehicle maintenance and repair (+2.4%), new vehicles (+0.8%), intracity transportation (+0.7%), tires (+0.4%), car and truck rental (+0.2%), motor vehicle insurance (+0.2%), parking fees and tolls (<0.0%), ship fare (<0.0%), other motor fuels (<0.0%), other intercity (-0.3%), leased cars and trucks (-0.5%), used cars and trucks (-3.9%), and gasoline (-6.9%). Text above the bar chart states that the overall transportation CPI increased 0.2% from January to February 2026 but fell 0.5% from January 2025 to January 2026.

For additional information and for interactive charts on transportation's role in the economy and changes (trends) over time, please visit BTS’ Transportation Economic Trends.