
Transportation Producer Price Index – May 2026
Today, the Bureau of Transportation Statistics (BTS) released the change in the costs faced by producers purchasing transportation services and industries producing them, from May 2025 to May 2026, as measured by the Producer Price Index (PPI). PPI measures inflation from the perspective of costs to industry or producers of products.
Transportation equipment PPI indicate the changes in transportation equipment prices faced by transportation providers, and any increase, increases providers costs. The PPI shows that prices increased for freight transportation and equipment by 2.5% in May 2026 from May 2025.
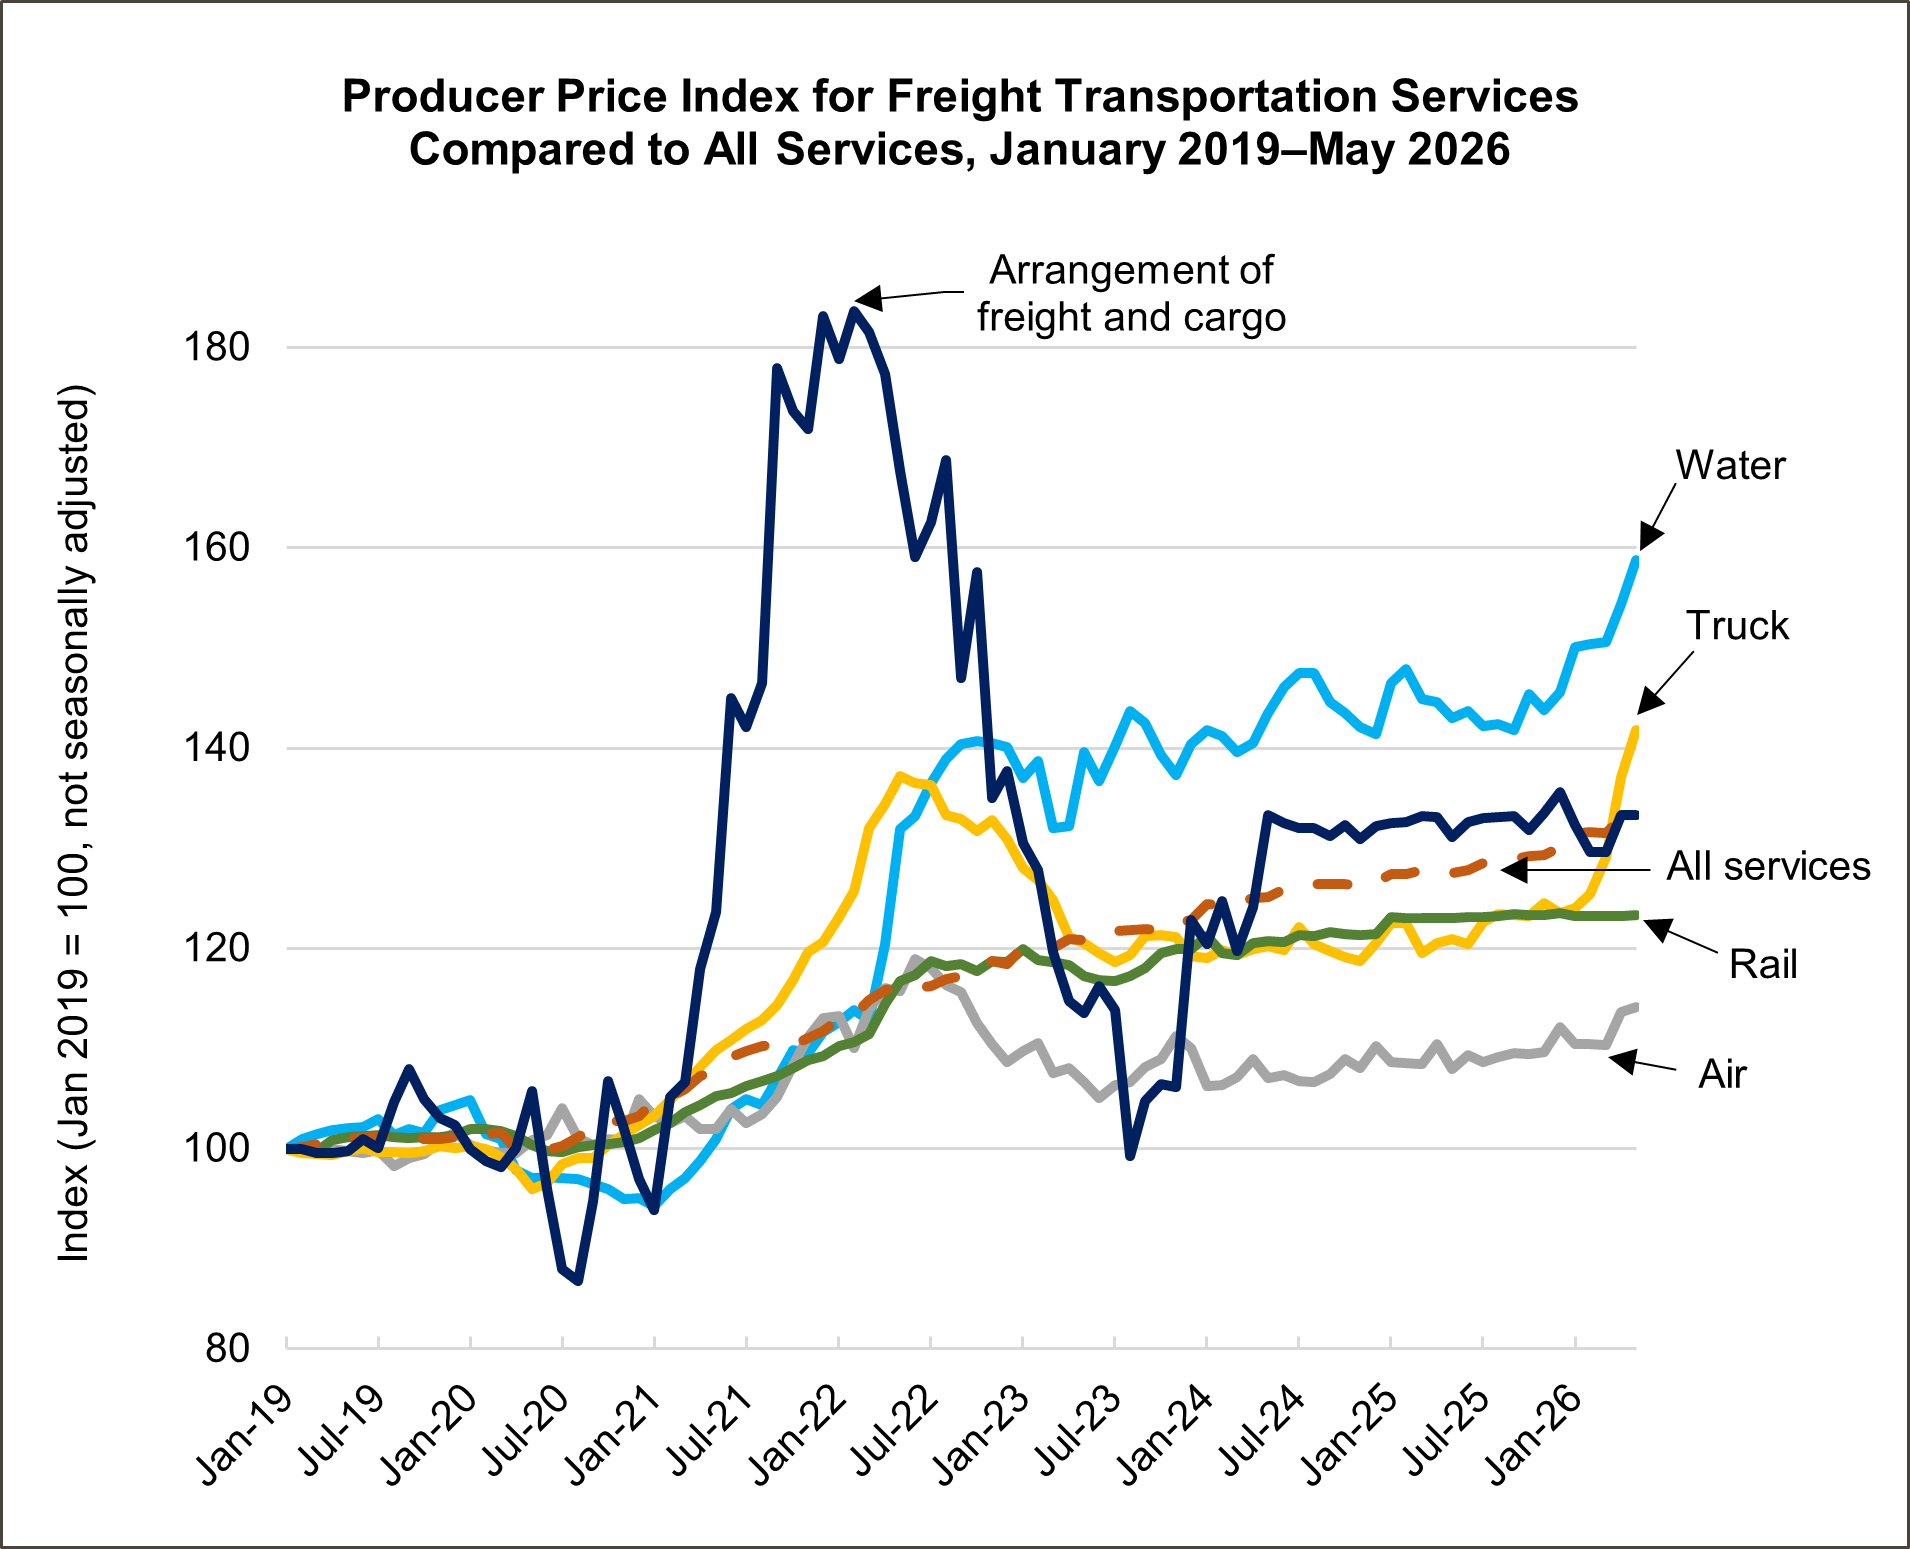
Increases in transportation services PPI indicate increases in production costs faced by industries purchasing the services. From May 2025 to May 2026, the transportation services PPI changed, by mode, as compared to all transportation and non-transportation services:
- Air: +5.7%
- Rail: +0.3%
- Truck: +17.3%
- Water: +11.0%
- Arrangement of freight and cargo: +1.7%
- All services (transportation and non-transportation): +4.7
Transportation contributed 19.4% to the overall increase in costs faced by producers for transportation and non-transportation services.
For additional information and for interactive charts on transportation's role in the economy and changes (trends) over time, please visit BTS’ Transportation Economic Trends.
To receive updates from BTS directly to your email, subscribe to our GovDelivery service.