
Transportation Services Contributed 6.3% to U.S. GDP in 2024; down from 2023 and from a high of 6.6% in 2022
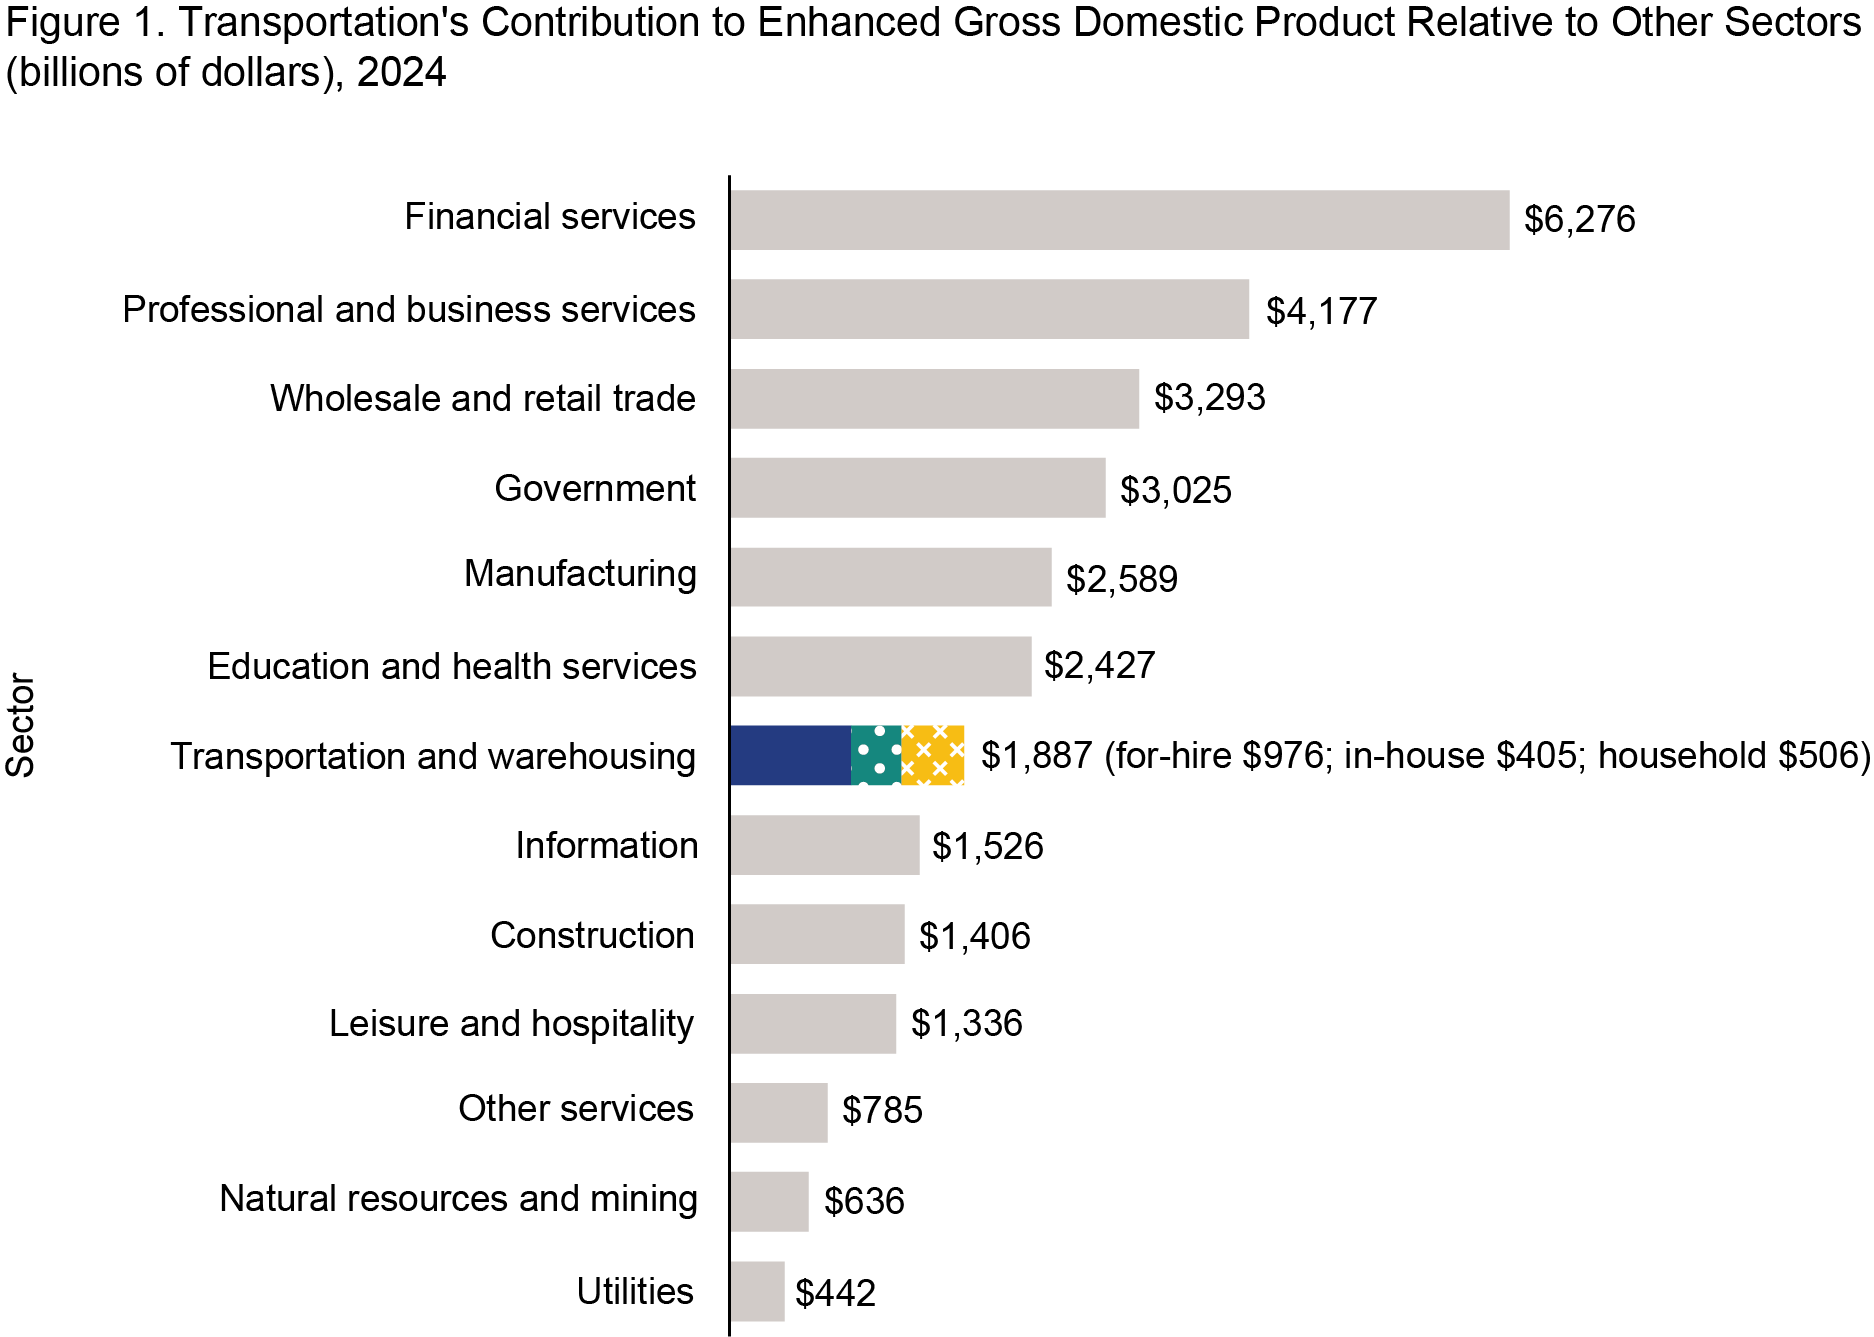
Transportation contributed $1.9 trillion (6.3%) to the economy in 2024
Transportation services (for-hire, in-house, and household) contributed $1.9 trillion (6.3%) to an enhanced U.S. gross domestic product (GDP)1 of $29.8 trillion in 2024—as measured by the Bureau of Transportation Statistics' (BTS) Transportation Satellite Accounts (TSAs). The TSAs measure the full contribution of transportation to the economy from three types of transportation activities:
- $976 billion or 3.3% of 2024 GDP from for-hire transportation,
- $405 billion or 1.4% of 2024 GDP from transportation activities carried out by non-transportation industries for their own purposes (known as in-house transportation),
- $506 billion or 1.7% of 2024 GDP from transportation activities carried out by households using personal motor vehicles.
Accounting for the contribution of in-house and household transportation nearly doubles the overall contribution of transportation to the economy as measured by GDP (figure 1). Including in-house transportation brought transportation up from the tenth largest contributor (out of 13 sectors) to the seventh largest contributor to the economy in 2024.
Source: U.S. Department of Transportation, Bureau of Transportation Statistics, Transportation Satellite Accounts
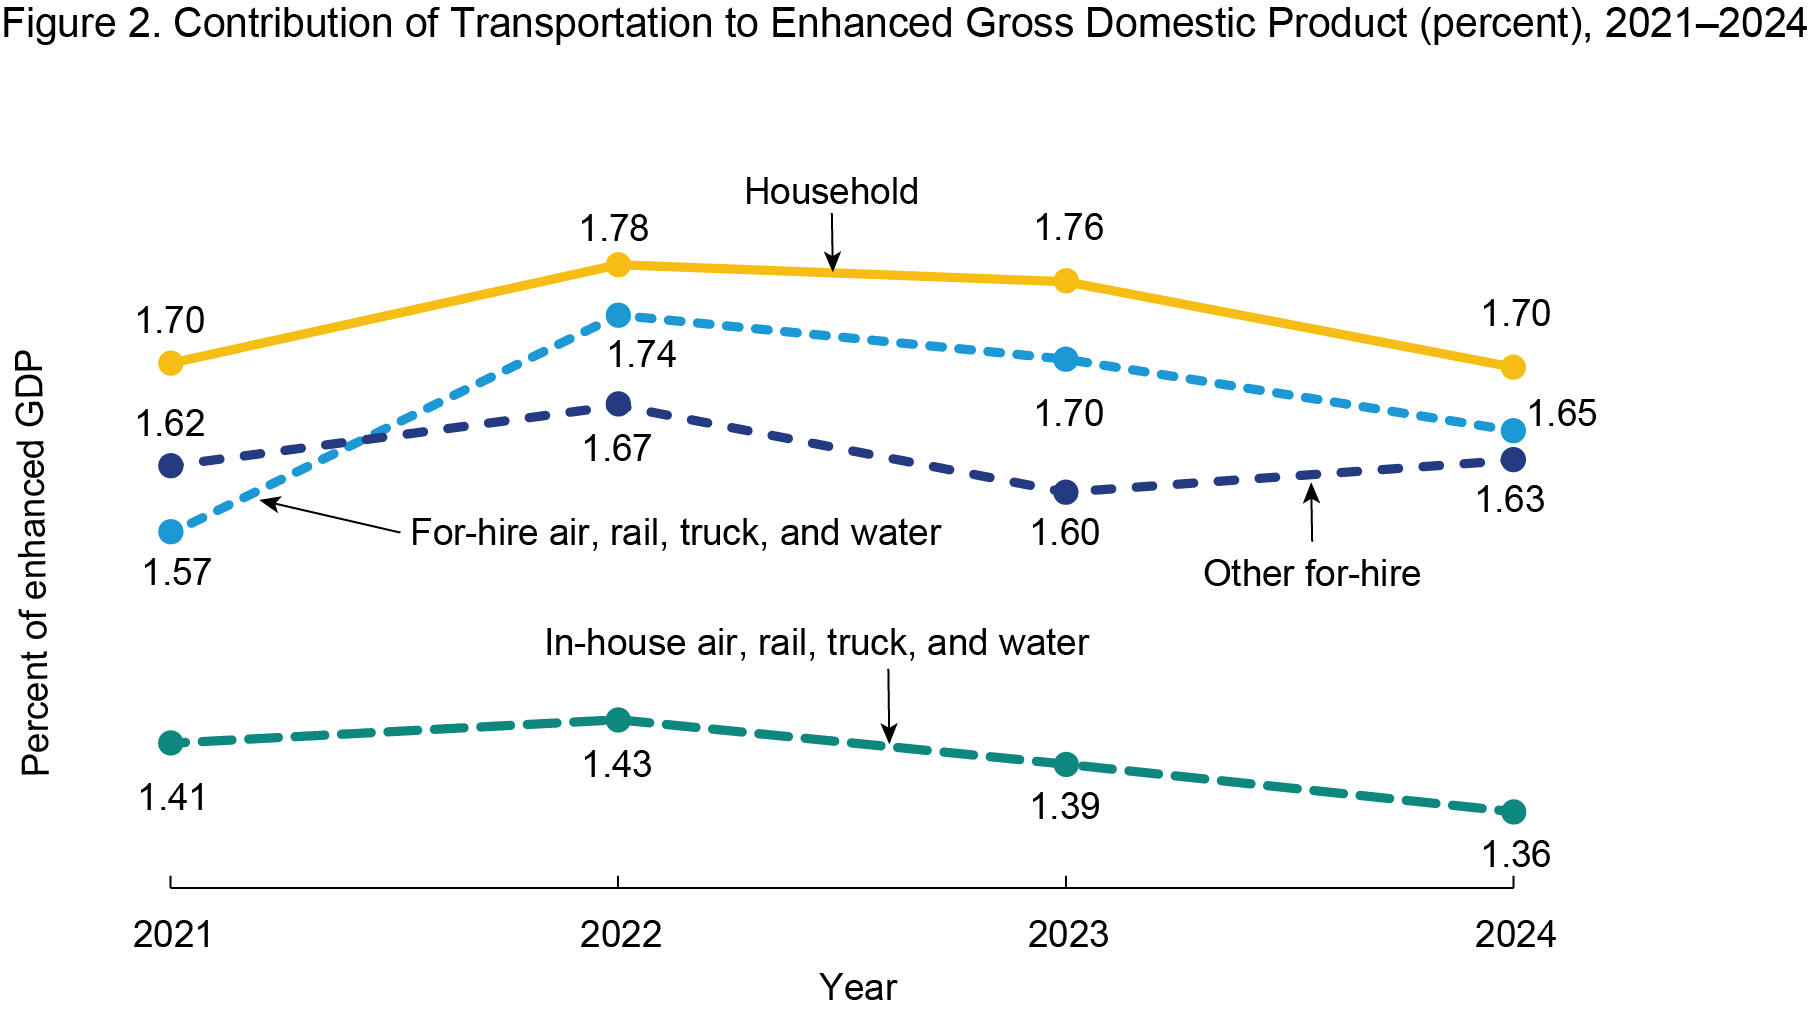
Transportation’s Contribution to the Economy Continues to Fall from 2022 High
The contribution of transportation to enhanced-GDP fell to 6.3% in 2024; down for the 2nd year after reaching a high of 6.6% in 2022.2 The decline follows from a decline in the contribution of for-hire air, rail, and truck transportation and from a decline in the contribution of household transportation. For-hire air, rail, and truck transportation collectively declined 0.1 percentage points in 2024 from 2023, falling back to its 2021 contribution level of 1.6%. Household transportation’s contribution likewise declined 0.1 percentage points in 2024 from 2023 and likewise fell back to its 2021 contribution level of 1.7%.
In-house air, rail, truck, and water transportation’s contribution to GDP remained unchanged from 2021 to 2024 at 1.4%. In 2024, all other for-hire3 transportation’s contribution remained unchanged from 2023 (1.6%) but declined 0.1 percentage points from its 2021 and 2022 level.
Source: U.S. Department of Transportation, Bureau of Transportation Statistics, Transportation Satellite Accounts
BTS released the TSAs with data for 2024 and revised years 2018 to 2023. BTS publishes several interactive visualizations highlighting the TSAs, including the Contribution of Transportation Services to the Economy and the Transportation Satellite Accounts, The Use of Transportation by Industry or Sector, and the Industry Snapshots.
1Enhanced GDP is the sum of GDP published in the U.S. National Accounts by the Bureau of Economic Analysis and the contribution of household transportation.
2Based on data from 2017 through 2024.
3All other for-hire transportation includes transit and passenger ground transportation (excluding state and local government passenger transit); sightseeing transportation and transportation support; parcel delivery, courier, and messenger services (excluding U.S. Postal Service); warehousing and storage; and other transportation and support activities.