
U.S. Airline August 2020 Passengers Decreased 70% from August 2019 but Rose 2% from July 2020 (Preliminary)
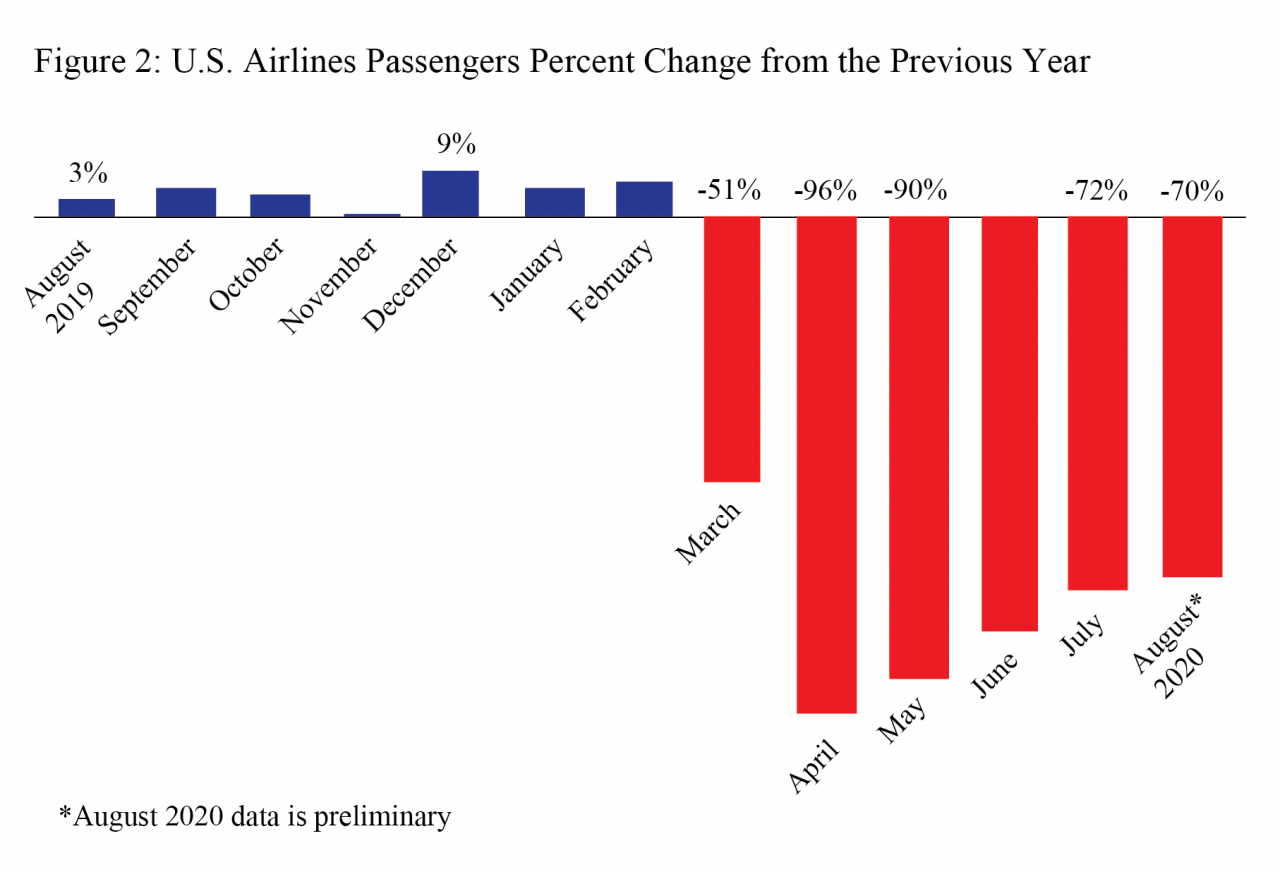
U.S. airlines carried 70% fewer scheduled service passengers in August 2020 than in August 2019, according to data filed with the Bureau of Transportation Statistics (BTS) by 21 airlines that carry more than 90% of the passengers. Despite the large annual drop from pre-pandemic numbers a year earlier (see graphic), when compared to the previous month U.S. airlines carried 2% more passengers in August 2020 than in July 2020.
The 70% decline from August 2019 was the smallest annual decrease since March.
The large airlines carried 24.4 million passengers in August 2020 (preliminary), up from 24.0 million passengers on all U.S. airlines in July 2020 and up from 3.0 million in April 2020, which was the lowest monthly total in BTS records dating back to 1974. The previous low was 14.6 million passengers in February 1975.
Preliminary August 2020 passenger numbers (21 carriers reporting):
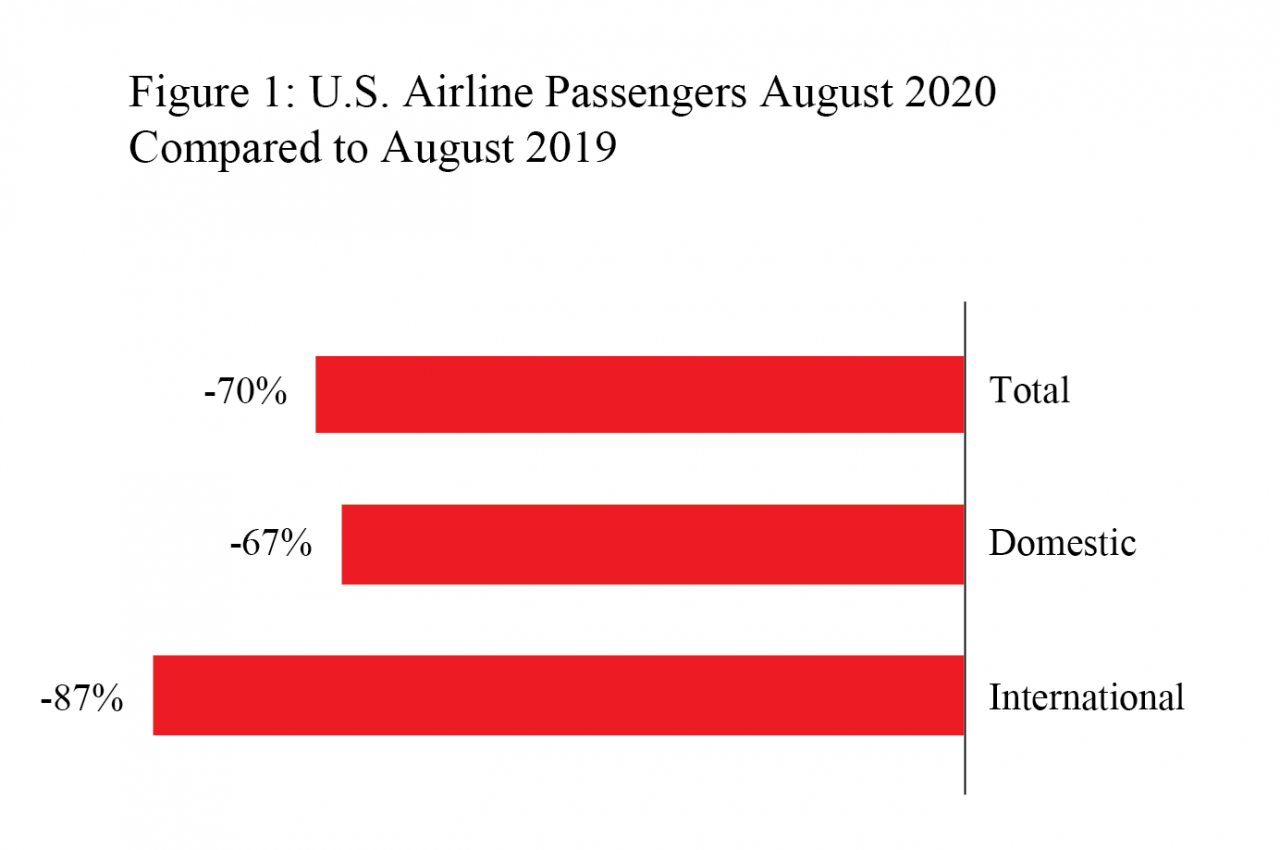
- Total: 24.4 million passengers, down 70% from August 2019 (80.8M) but up 2% from July 2020 (24.0M)
- Domestic: 23.0 million passengers, down 67% from August 2019 (69.9M)
- International: 1.4 million passengers, down 87% from August 2019 (10.9M)
U.S. airline traffic reports are filed monthly with BTS. Final August data will be released on Nov. 13. Complete international data by origin and destination, which is under a six-month confidentiality restriction, will be released on Feb. 11.
| 2016-2017 | 2017-2018 | 2018-2019 | 2019-2020 | |
|---|---|---|---|---|
January | 3.0 | 2.9 | 4.0 | 5.6 |
February | -0.2 | 5.7 | 3.0 | 6.7 |
March | 3.4 | 4.6 | 5.1 | -51.3 |
April | 4.5 | 4.8 | 3.8 | -96.1 |
May | 3.0 | 4.9 | 5.2 | -89.6 |
June | 3.4 | 5.0 | 3.7 | -80.3 |
July | 3.8 | 5.2 | 3.6 | -72.4 |
August | 5.0 | 5.0 | 3.4 | -69.8* |
September | -2.3 | 5.8 | 5.7 | |
October | 4.6 | 3.9 | 4.1 | |
November | 4.6 | 4.5 | 0.5 | |
| December | 3.5 | 3.6 | 8.8 | |
| Annual | 3.1 | 4.7 | 4.2 |
Source: Bureau of Transportation Statistics, T-100 Market
* August 2020 data is preliminary
| 2016-2017 | 2017-2018 | 2018-2019 | 2019-2020 | |
|---|---|---|---|---|
January | 3.1 | 3.2 | 3.9 | 6.2 |
February | -0.1 | 5.9 | 3.0 | 7.4 |
March | 3.8 | 4.2 | 5.4 | -51.0 |
April | 3.7 | 5.7 | 3.7 | -95.7 |
May | 2.7 | 5.3 | 5.2 | -88.5 |
June | 3.1 | 5.3 | 3.6 | -77.9 |
July | 3.7 | 5.8 | 3.8 | -69.6 |
August | 5.0 | 5.5 | 3.4 | -67.0* |
September | -2.5 | 5.8 | 5.8 | |
October | 4.7 | 3.8 | 4.2 | |
November | 4.5 | 4.4 | 0.2 | |
| December | 3.7 | 3.7 | 9.5 | |
| Annual | 3.0 | 4.9 | 4.3 |
Source: Bureau of Transportation Statistics, T-100 Domestic Market
* August 2020 data is preliminary
| 2016-2017 | 2017-2018 | 2018-2019 | 2019-2020 | |
|---|---|---|---|---|
| January | 2.1 | 1.0 | 4.5 | 1.9 |
February | -1.2 | 4.6 | 3.4 | 0.7 |
March | 0.4 | 7.2 | 3.1 | -53.3 |
April | 9.8 | -1.0 | 4.3 | -98.6 |
May | 5.4 | 2.3 | 5.3 | -98.1 |
June | 5.3 | 3.4 | 4.2 | -96.4 |
July | 4.6 | 1.6 | 2.2 | -90.4 |
August | 4.9 | 2.0 | 3.9 | -87.4* |
September | -1.1 | 5.9 | 4.6 | |
October | 3.2 | 4.3 | 3.2 | |
November | 5.4 | 4.7 | 2.2 | |
| December | 1.7 | 3.2 | 3.6 | |
| Annual | 3.5 | 3.1 | 3.8 |
Source: Bureau of Transportation Statistics, T-100 International Market
* August 2020 data is preliminary
Reporting Notes
Data are compiled from monthly reports filed with BTS by commercial U.S. air carriers detailing operations, passenger traffic and freight traffic. This release includes data received by BTS from U.S. airlines as of Oct. 5.
See the BTS Airlines and Airports page for additional U.S. airlines numbers through June for U.S. airlines. International data by origin and destination is available through March.
None of the data are from samples. Measures of statistical significance do not apply to the complete air traffic data.