
U.S. Airlines Carried 1.8% Less International Cargo in November 2021 than in November 2020 (Preliminary); Domestic Air Cargo Up 0.3%
BTS 06-22
Overall air cargo remains up 12.7% over pre-pandemic November 2019
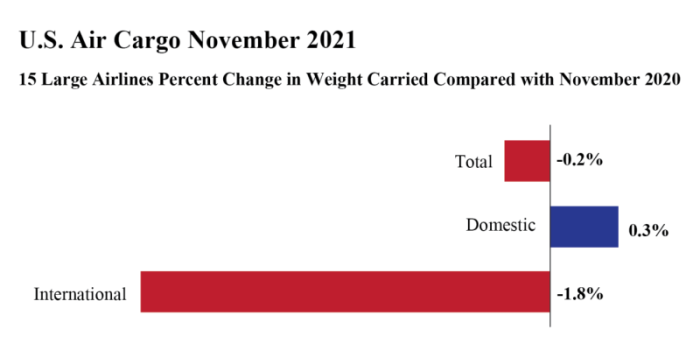
U.S. Airlines Carried 0.2% less cargo by weight in November 2021 (preliminary) than in November 2020. The decrease comprises a gain of 0.3% in domestic cargo and a loss of 1.8% in international cargo, according to data filed with the Bureau of Transportation Statistics (BTS) by 14 of the leading U.S. cargo airlines.
The 14 airlines carry 95% of total cargo by weight transported on U.S. airlines. Cargo data consists of freight and mail carried within the U.S. and between the U.S. and foreign points.
November 2021 (preliminary) air cargo numbers for 14 U.S. cargo carriers:
- Total: 1,650 thousand tons, down 0.2% from Nov. 2020, up 12.7% from Nov. 2019
- Domestic: 1,211 thousand tons, up 0.3% from Nov. 2020, up 14.0% from Nov. 2019
- International: 439 thousand tons, down 1.8% from Nov. 2020, up 9.4% from Nov. 2019
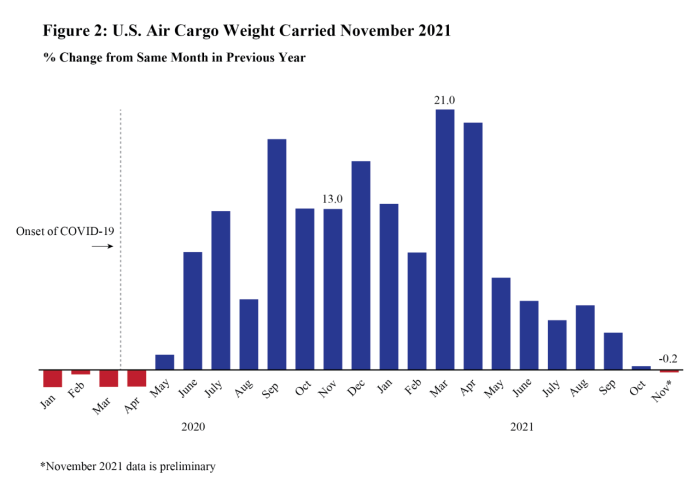
Figure 2: U.S. Airlines Cargo Weight Carried November 2021
| Month | % Change from Same Month in Previous Year |
|---|---|
| Jan-20 | -1.4 |
| Feb-20 | -0.4 |
| Mar-20 | -1.4 |
| Apr-20 | -1.3 |
| May-20 | 1.2 |
| Jun-20 | 9.5 |
| Jul-20 | 12.8 |
| Aug-20 | 5.7 |
| Sep-20 | 18.6 |
| Oct-20 | 13.0 |
| Nov-20 | 13.0 |
| Dec-20 | 16.9 |
| Jan-21 | 13.4 |
| Feb-21 | 9.5 |
| Mar-21 | 21.0 |
| Apr-21 | 20.0 |
| May-21 | 7.4 |
| Jun-21 | 5.6 |
| Jul-21 | 4.0 |
| Aug-21 | 5.2 |
| Sep-21 | 3.0 |
| Oct-21 | 0.3 |
| Nov-21 | -0.2 |
U.S. airline traffic reports are filed monthly with BTS. Final November data will be released on February 10, 2022. Complete international data by origin and destination, which is under a six-month confidentiality restriction, will be released on May 12, 2022.
Systemwide Cargo (Domestic + International)
- November 2021 cargo: 1,649 thousand tons
- Change from October 2021: -4.8%
- Change from November 2020: -0.2%
- Change from November 2019: 12.7%
- Recent high: December 2020 (1,854 thousand tons)
- Recent low: February 2020 (1,255 thousand tons)
Table 1: Systemwide Percent Change in U.S. Airlines Cargo by Weight from the Same Month of the Previous Year 2017-2020
Cargo = Freight + Mail
|
Year-to-Year Percent Change |
||||
|
|
2017 - 2018 |
2018 - 2019 |
2019 - 2020 |
2020 - 2021 |
|
January |
10.6 |
4.9 |
-1.4 |
13.4 |
|
February |
9.3 |
-0.4 |
-0.4 |
9.5 |
|
March |
5.7 |
-0.3 |
-1.4 |
21.0 |
|
April |
5.7 |
4.5 |
-1.3 |
20.0 |
|
May |
9.0 |
3.1 |
1.2 |
7.4 |
|
June |
5.6 |
-1.2 |
9.5 |
5.6 |
|
July |
6.6 |
3.6 |
12.8 |
4.0 |
|
August |
4.8 |
0.2 |
5.7 |
5.2 |
|
September |
4.9 |
-4.5 |
18.6 |
3.0 |
|
October |
5.7 |
-1.2 |
13.0 |
0.3 |
|
November |
-0.7 |
-2.2 |
13.0 |
-0.2 |
|
December |
0.2 |
0.7 |
16.9 |
- |
|
YTD Jan - Nov |
6.7 |
0.8 |
5.7 |
8.5 |
|
Annual |
5.4 |
0.5 |
7.3 |
- |
Source: Bureau of Transportation Statistics, T-100 Market
* November 2021 data is preliminary
Domestic Cargo
- November 2021 cargo: 1,210 thousand tons
- Change from October 2021: -3.8%
- Change from November 2020: +0.3%
- Change from November 2019: 14.0%
- Recent high: December 2020 (1,420 thousand tons)
- Recent low: February 2020 (944 thousand tons)
- Domestic as percent of total cargo November 2021: 73.4%
- Domestic as percent of total cargo November 2020: 73.0%
- Domestic as percent of total cargo November 2019: 73.4%
Table 2: Domestic Percent Change in U.S. Airlines Cargo by Weight from the Same Month of the Previous Year 2017-2020
Domestic cargo has a U.S. origin and U.S. destination
Cargo = Freight + Mail
|
Year-to-Year Percent Change |
|||||
|
|
2017 - 2018 |
2018 - 2019 |
2019 - 2020 |
2020 - 2021 |
|
|
January |
10.3 |
6.2 |
0.5 |
12.5 |
|
|
February |
9.0 |
0.7 |
1.9 |
4.7 |
|
|
March |
3.9 |
-0.2 |
3.4 |
15.9 |
|
|
April |
4.9 |
8.2 |
3.8 |
12.6 |
|
|
May |
9.0 |
4.6 |
4.7 |
2.0 |
|
|
June |
4.6 |
0.7 |
13.3 |
2.6 |
|
|
July |
6.7 |
6.7 |
15.8 |
1.1 |
|
|
August |
4.7 |
0.2 |
7.2 |
4.0 |
|
|
September |
4.1 |
-2.8 |
21.7 |
1.3 |
|
|
October |
6.1 |
1.7 |
14.3 |
-2.4 |
|
|
November |
-0.4 |
-1.6 |
13.6 |
0.3 |
|
|
December |
0.1 |
4.6 |
15.9 |
- |
|
|
YTD Jan - Nov |
6.2 |
2.5 |
8.7 |
5.1 |
|
|
Annual |
5.0 |
2.4 |
9.8 |
- |
|
Source: Bureau of Transportation Statistics, T-100 Domestic Market
* November 2021 data is preliminary
International Cargo
- November 2021 cargo: 439 thousand tons
- Change from October 2021: -7.4%
- Change from November 2020: -1.8%
- Change from November 2019: 9.4%
- Recent high: November 2020 (447 thousand tons)
- Recent low: February 2020 (311 thousand tons)
- Domestic as percent of total cargo November 2021: 26.6%
- Domestic as percent of total cargo November 2020: 27.0%
- Domestic as percent of total cargo November 2019: 26.6%
Table 3: International Percent Change in U.S. Airlines Cargo by Weight from the Same Month of the Previous Year 2017-2020
International cargo on a U.S. airline is carried between a U.S. airport and a foreign airport.
Cargo = Freight + Mail
|
Year-to-Year Percent Change |
|||||
|
|
2017 - 2018 |
2018 - 2019 |
2019 - 2020 |
2020 - 2021 |
|
|
January |
11.3 |
1.5 |
-6.7 |
16.0 |
|
|
February |
10.2 |
-3.4 |
-6.7 |
24.0 |
|
|
March |
10.6 |
-0.5 |
-13.6 |
36.9 |
|
|
April |
7.7 |
-4.5 |
-15.4 |
44.6 |
|
|
May |
8.9 |
-1.0 |
-8.4 |
24.6 |
|
|
June |
8.4 |
-5.7 |
-0.7 |
14.5 |
|
|
July |
6.5 |
-4.1 |
4.5 |
12.9 |
|
|
August |
5.2 |
0.1 |
1.6 |
8.9 |
|
|
September |
6.8 |
-8.8 |
10.5 |
8.2 |
|
|
October |
4.6 |
-8.7 |
9.5 |
8.1 |
|
|
November |
-1.5 |
-3.7 |
11.4 |
-1.8 |
|
|
December |
0.4 |
-10.7 |
20.1 |
- |
|
|
YTD Jan - Nov |
7.9 |
-3.6 |
-2.5 |
18.9 |
|
|
Annual |
6.4 |
-4.2 |
0.4 |
- |
|
Source: Bureau of Transportation Statistics, T-100 International Market
* November data is preliminary
Reporting Notes
Data are compiled from monthly reports filed with BTS by commercial U.S. air carriers detailing operations, passenger traffic and freight traffic. This release includes data received by BTS from 14 U.S. airlines as of January 20, 2021.
See the BTS Airlines and Airports page for additional U.S. airlines numbers through October 2021 for U.S. airlines. International data by origin and destination is available through July 2021.
None of the data are from samples. Measures of statistical significance do not apply to the complete air traffic data. Numbers in this release are not seasonally-adjusted.