
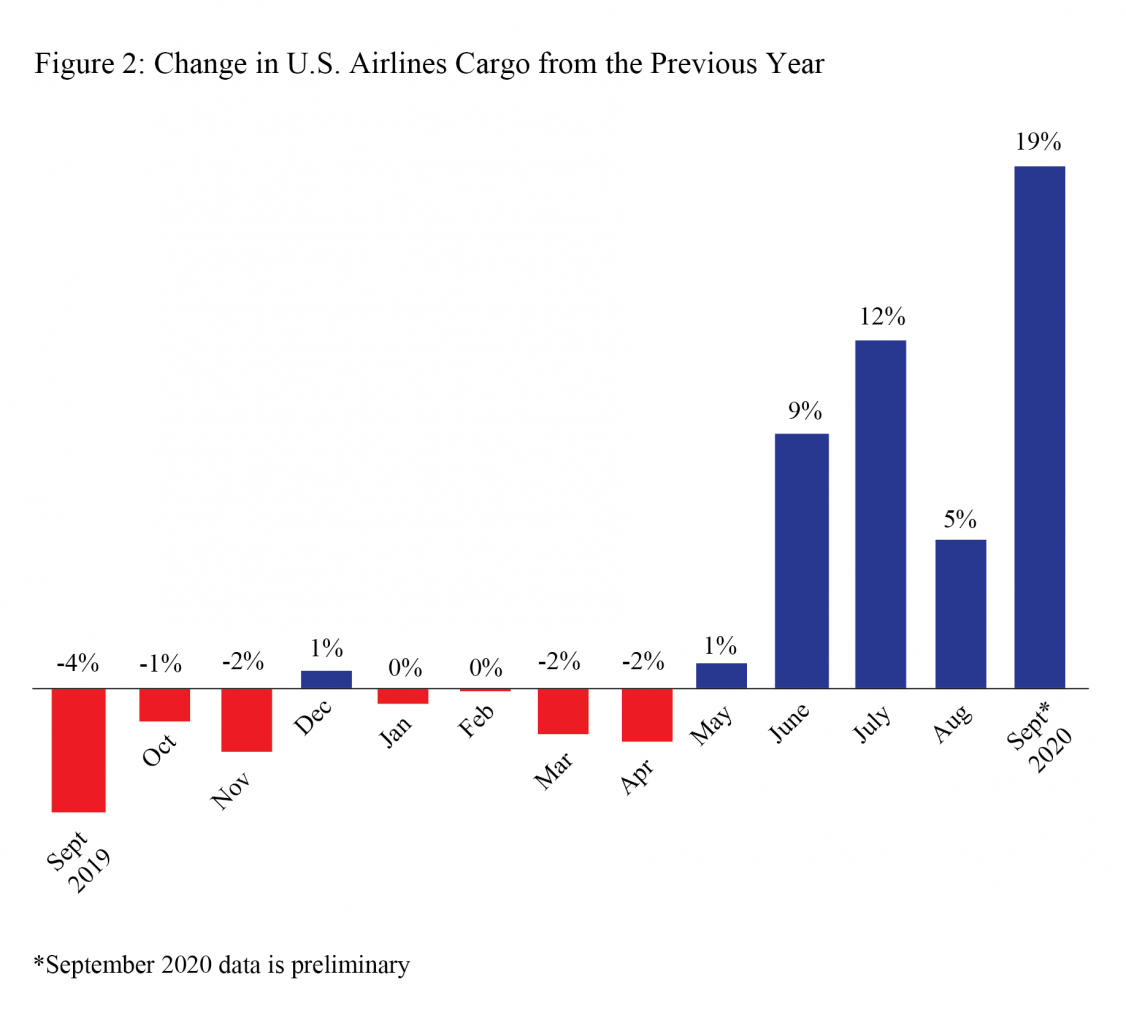
U.S. Airlines Carried 19% More Cargo in September 2020 than in September 2019
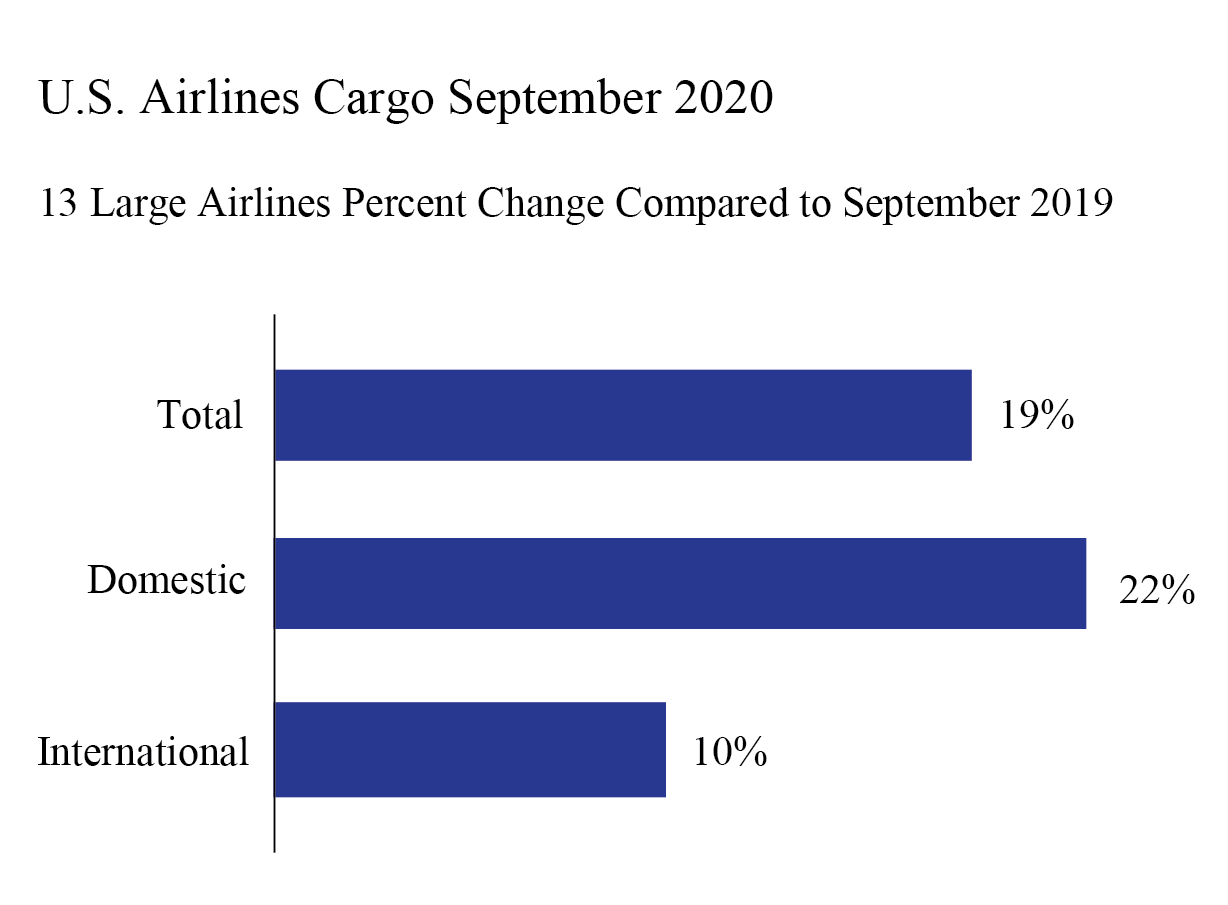
U.S. airlines carried 19% more cargo by weight in September 2020 (preliminary) than in September 2019. The rise was fueled by a gain of 22% in domestic cargo and a 10% rise in international cargo, according to data filed with the Bureau of Transportation Statistics (BTS) by 15 of the leading U.S. cargo airlines.
The 15 airlines carry 95% of the total cargo by weight on U.S. airlines. Cargo data consists of freight and mail carried within the U.S. and between the U.S. and foreign points.
September 2020 (preliminary) air cargo numbers for 15 U.S. carriers:
- Total: 1,625 thousand tons, up 18.6% from September 2019 (1,370T tons)
- Domestic: 1,212T tons, up 21.7% from September 2019 (996T tons)
- International: 413Ttons, up 10.5% from September 2019 (374T tons)
U.S. airline traffic reports are filed monthly with BTS. Final September data will be released on Dec. 10. Complete international data by origin and destination, which is under a six-month confidentiality restriction, will be released on March 11.
| 2016-2017 | 2017-2018 | 2018-2019 | 2019-2020 | |
|---|---|---|---|---|
January | 6.4 | 10.5 | 5.1 | -0.5 |
February | 6.1 | 9.2 | -0.3 | -0.1 |
March | 8.0 | 5.8 | -0.2 | -1.6 |
April | 2.6 | 5.9 | 4.4 | -1.9 |
May | 10.8 | 9.0 | 3.1 | 0.9 |
June | 6.8 | 5.5 | -1.1 | 9.1 |
July | 6.9 | 6.7 | 3.5 | 12.8 |
August | 9.7 | 5.0 | 0.2 | 5.3 |
September | 4.3 | 5.0 | -4.4 | 18.6* |
October | 10.6 | 5.5 | -1.2 | |
November | 10.6 | -0.6 | -2.3 | |
| December | 5.6 | 0.3 | 0.7 | |
| Jan-Sept | 6.8 | 6.9 | 1.1 | 4.7 |
| Annual | 7.4 | 5.4 | 0.6 |
Source: Bureau of Transportation Statistics, T-100 Market
* September 2020 data is preliminary
| 2016-2017 | 2017-2018 | 2018-2019 | 2019-2020 | |
|---|---|---|---|---|
| January | 4.6 | 10.4 | 6.1 | 2.8 |
February | 4.9 | 8.7 | 0.7 | 2.2 |
March | 7.1 | 4.0 | -0.4 | 3.1 |
April | 1.5 | 4.9 | 7.7 | 3.1 |
May | 10.8 | 8.9 | 4.5 | 4.2 |
June | 5.4 | 4.5 | 0.5 | 12.7 |
July | 5.2 | 6.7 | 6.2 | 15.8 |
August | 9.4 | 4.8 | 0.1 | 6.6 |
September | 3.3 | 4.3 | -2.9 | 21.7* |
October | 11.1 | 5.7 | 1.8 | |
November | 11.3 | -0.1 | -1.8 | |
December | 5.1 | 0.1 | 4.5 | |
Jan-Sept | 5.8 | 6.3 | 2.5 | 7.9 |
| Annual | 6.7 | 5.0 | 2.2 |
Source: Bureau of Transportation Statistics, T-100 Domestic Market
* September 2020 data is preliminary
| 2016-2017 | 2017-2018 | 2018-2019 | 2019-2020 | |
|---|---|---|---|---|
| January | 11.4 | 10.6 | 2.2 | -9.8 |
February | 9.6 | 10.4 | -3.1 | -6.3 |
March | 10.5 | 10.7 | 0.4 | -13.9 |
April | 5.3 | 8.2 | -3.9 | -15.7 |
May | 11.0 | 9.2 | -0.6 | -8.3 |
June | 10.8 | 8.2 | -5.2 | -0.6 |
July | 11.3 | 6.7 | -3.6 | 4.5 |
August | 10.6 | 5.6 | 0.4 | 1.7 |
September | 7.2 | 7.0 | -8.3 | 10.5* |
October | 9.4 | 5.0 | -8.7 | |
November | 8.8 | -1.8 | -3.5 | |
December | 7.2 | 0.9 | -10.6 | |
Jan-Sept | 9.7 | 8.4 | -2.4 | -4.3 |
| Annual | 9.4 | 6.5 | -3.8 |
Source: Bureau of Transportation Statistics, T-100 International Market
* September 2020 data is preliminary
Reporting Notes
Data are compiled from monthly reports filed with BTS by commercial U.S. air carriers detailing operations, passenger traffic and freight traffic. This release includes data received by BTS from 15 U.S. airlines as of Nov. 5.
See the BTS Airlines and Airports page for additional U.S. airlines numbers through July for U.S. airlines. International data by origin and destination is available through April. August data with May international numbers will be posted Friday at 11 a.m.
None of the data are from samples. Measures of statistical significance do not apply to the complete air traffic data.