
U.S. Airlines February 2021 Passengers Decreased 61% from February 2020 (Preliminary)
Release Number: BTS 23-21
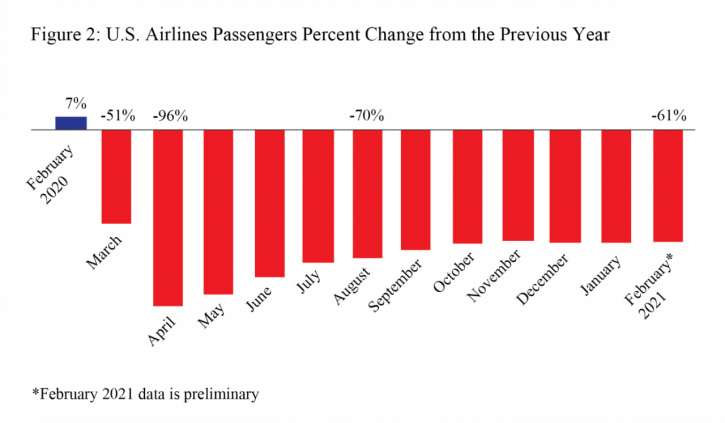
U.S. airlines carried 61% fewer scheduled service passengers in February 2021 than in February 2020 (preliminary), according to data filed with the Bureau of Transportation Statistics (BTS) by 22 airlines that carry more than 90% of the passengers. February was the fifth straight month of year-over-year declines slightly above 60%.
The large airlines carried 26.5 million passengers in February 2021 (preliminary), compared to 67.6 million passengers in February 2020 and 3.0 million in April 2020, which was the lowest monthly total in BTS records dating back to 1974. The previous low was 14.6 million passengers in February 1975.
Preliminary February 2021 passenger numbers (22 carriers reporting):
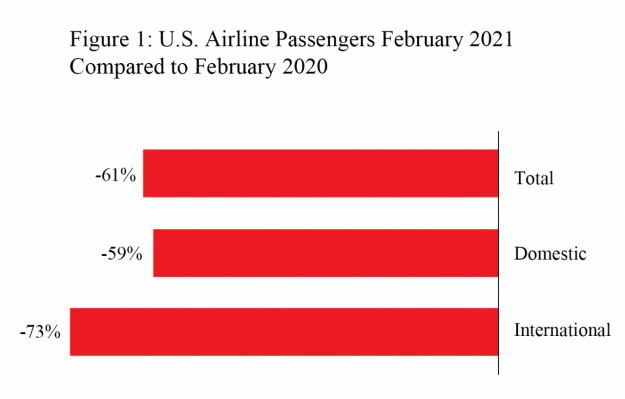
- Total: 26.5 million passengers, down 61% from February 2020 (67.6M)
- Domestic: 24.4 million passengers, down 59% from February 2020 (59.6M)
- International: 2.1 million passengers, down 73% from February 2020 (7.9M)
U.S. airline traffic reports are filed monthly with BTS. Final February data will be released on May 13. Complete international data by origin and destination, which is under a six-month confidentiality restriction, will be released on Aug. 12.
Systemwide Passengers
- February 2021 passengers: 26.5M
- Change from February 2020: -61%
- Percent of 2020 passengers: 39%
- Change from April 2020 low: +24.2M passengers
Table 1: Systemwide Percent Change in US Airlines Scheduled Service Passengers from the Same Month of the Previous Year, 2017-2021
|
Year-to-Year Percent Change |
||||
|
|
2017 - 2018 |
2018 - 2019 |
2019 - 2020 |
2020 - 2021 |
|
January |
3.0 |
5.2 |
5.7 |
-61.4 |
|
February |
5.8 |
4.2 |
6.7 |
-60.8* |
|
March |
4.6 |
6.4 |
-51.3 |
|
|
April |
6.0 |
3.9 |
-96.1 |
|
|
May |
6.1 |
5.3 |
-89.6 |
|
|
June |
6.2 |
3.7 |
-80.3 |
|
|
July |
6.4 |
3.7 |
-72.4 |
|
|
August |
6.3 |
3.5 |
-69.8 |
|
|
September |
7.1 |
5.7 |
-65.2 |
|
|
October |
5.0 |
4.2 |
-61.8 |
|
|
November |
5.7 |
0.5 |
-60.7 |
|
|
December |
4.8 |
8.9 |
-61.5 |
|
|
Jan-Feb |
4.4 |
4.7 |
6.2 |
-61.1 |
|
Annual |
5.6 |
4.6 |
-60.1 |
|
Source: Bureau of Transportation Statistics, T-100 Market
*February 2021 data is preliminary
Domestic Passengers
- February 2021 passengers: 24.4M
- Change from February 2020: -59%
- Percent of 2020 passengers: 41%
- Change from April 2020 low: +21.5M passengers
- Domestic percent of total February 2021 passengers: 92%
- Domestic percent of total February 2020 passengers: 88%
Table 2: Domestic Percent Change in US Airlines Scheduled Service Passengers from the Same Month of the Previous Year, 2017-2021
|
Year-to-Year Percent Change |
||||
|
|
2017 - 2018 |
2018 - 2019 |
2019 - 2020 |
2020 - 2021 |
|
January |
3.3 |
5.3 |
6.2 |
-60.5 |
|
February |
6.0 |
4.2 |
7.5 |
-59.1* |
|
March |
4.2 |
6.7 |
-51.0 |
|
|
April |
7.0 |
3.8 |
-95.7 |
|
|
May |
6.6 |
5.3 |
-88.5 |
|
|
June |
6.6 |
3.6 |
-77.9 |
|
|
July |
7.2 |
3.9 |
-69.6 |
|
|
August |
6.9 |
3.5 |
-67.1 |
|
|
September |
7.2 |
5.9 |
-62.7 |
|
|
October |
5.0 |
4.3 |
-59.9 |
|
|
November |
5.8 |
0.3 |
-59.4 |
|
|
December |
5.0 |
9.6 |
-60.9 |
|
|
Jan-Feb |
4.6 |
4.8 |
6.9 |
-59.8 |
|
Annual |
5.9 |
4.6 |
-58.7 |
|
Source: Bureau of Transportation Statistics, T-100 Domestic Market
* February 2021 data is preliminary
International Passengers
- February 2021 passengers: 2.1M
- Change from February 2020: -73%
- Percent of 2020 passengers: 27%
- Change from April 2020 low: +2M passengers
- International percent of total February 2021 passengers: 8%
- International percent of total February 2020 passengers: 12%
Table 3: International Percent Change in US Airlines Scheduled Service Passengers from the Same Month of the Previous Year, 2017-2021
|
Year-to-Year Percent Change |
||||
|
|
2017 - 2018 |
2018 - 2019 |
2019 - 2020 |
2020 - 2021 |
|
January |
1.3 |
4.8 |
2.1 |
-67.3 |
|
February |
4.8 |
3.8 |
1.0 |
-73.4* |
|
March |
7.4 |
3.8 |
-53.3 |
|
|
April |
-0.6 |
4.7 |
-98.6 |
|
|
May |
2.7 |
5.7 |
-98.1 |
|
|
June |
3.7 |
4.3 |
-96.4 |
|
|
July |
1.9 |
2.3 |
-90.4 |
|
|
August |
2.5 |
3.9 |
-87.5 |
|
|
September |
6.3 |
4.7 |
-83.7 |
|
|
October |
4.6 |
3.4 |
-77.3 |
|
|
November |
5.0 |
2.4 |
-70.3 |
|
|
December |
3.6 |
4.0 |
-66.0 |
|
|
Jan-Feb |
2.9 |
4.3 |
1.6 |
-70.1 |
|
Annual |
3.5 |
4.0 |
-70.4 |
|
Source: Bureau of Transportation Statistics, T-100 International Market
* February 2021 data is preliminary
Reporting Notes
Data are compiled from monthly reports filed with BTS by commercial U.S. air carriers detailing operations, passenger traffic and freight traffic. This release includes data received by BTS from U.S. airlines as of April 6.
See the BTS Airlines and Airports page for additional U.S. airlines numbers through December for U.S. airlines. International data by origin and destination is available through September.
None of the data are from samples. Measures of statistical significance do not apply to the complete air traffic data.