


U.S. Airlines’ July 2026 Aviation Fuel Cost down 1.8%, Consumption up 3.8%, and Fuel Cost per Gallon down 5.4% from June 2026
BTS 26-67
This release is published on a fixed schedule as required by the Office of Management and Budget, and statistics in this release may be revised when inputs to the statistics are corrected or updated. Data on the program page of this website are the most up-to-date and complete. All costs are in current dollars. All fuel consumption data is in regard to fuel paid for by the carrier.
The Department of Transportation’s Bureau of Transportation Statistics (BTS) today released U.S. airlines’ July 2026 fuel cost and consumption numbers indicating total fuel expenditure ($5.89B) of U.S. scheduled service airlines was down 1.8% from June 2026 ($5.99B) and up 43.0% from July 2025 ($4.12B). The airlines used 1.732 billion gallons of fuel, 3.8% more fuel than in June 2026 (1.668 billion gallons) and 1.6% less fuel than July 2025 (1.760 billion gallons). The cost per gallon of fuel in July 2026 ($3.40) was down 19 cents (5.4%) from June 2026 ($3.59) and up $1.06 (45.4%) from July 2025 ($2.34).
Note: Alaska Airlines (AS) and Hawaiian Airlines (HA) have merged and now report combined fuel data under Alaska Airlines (AS).
| Total fuel cost for U.S. airlines (total) scheduled service | |
| July 2025 | $4.12 billion |
| June 2026 | $5.99 billion |
| July 2026 | $5.89 billion |
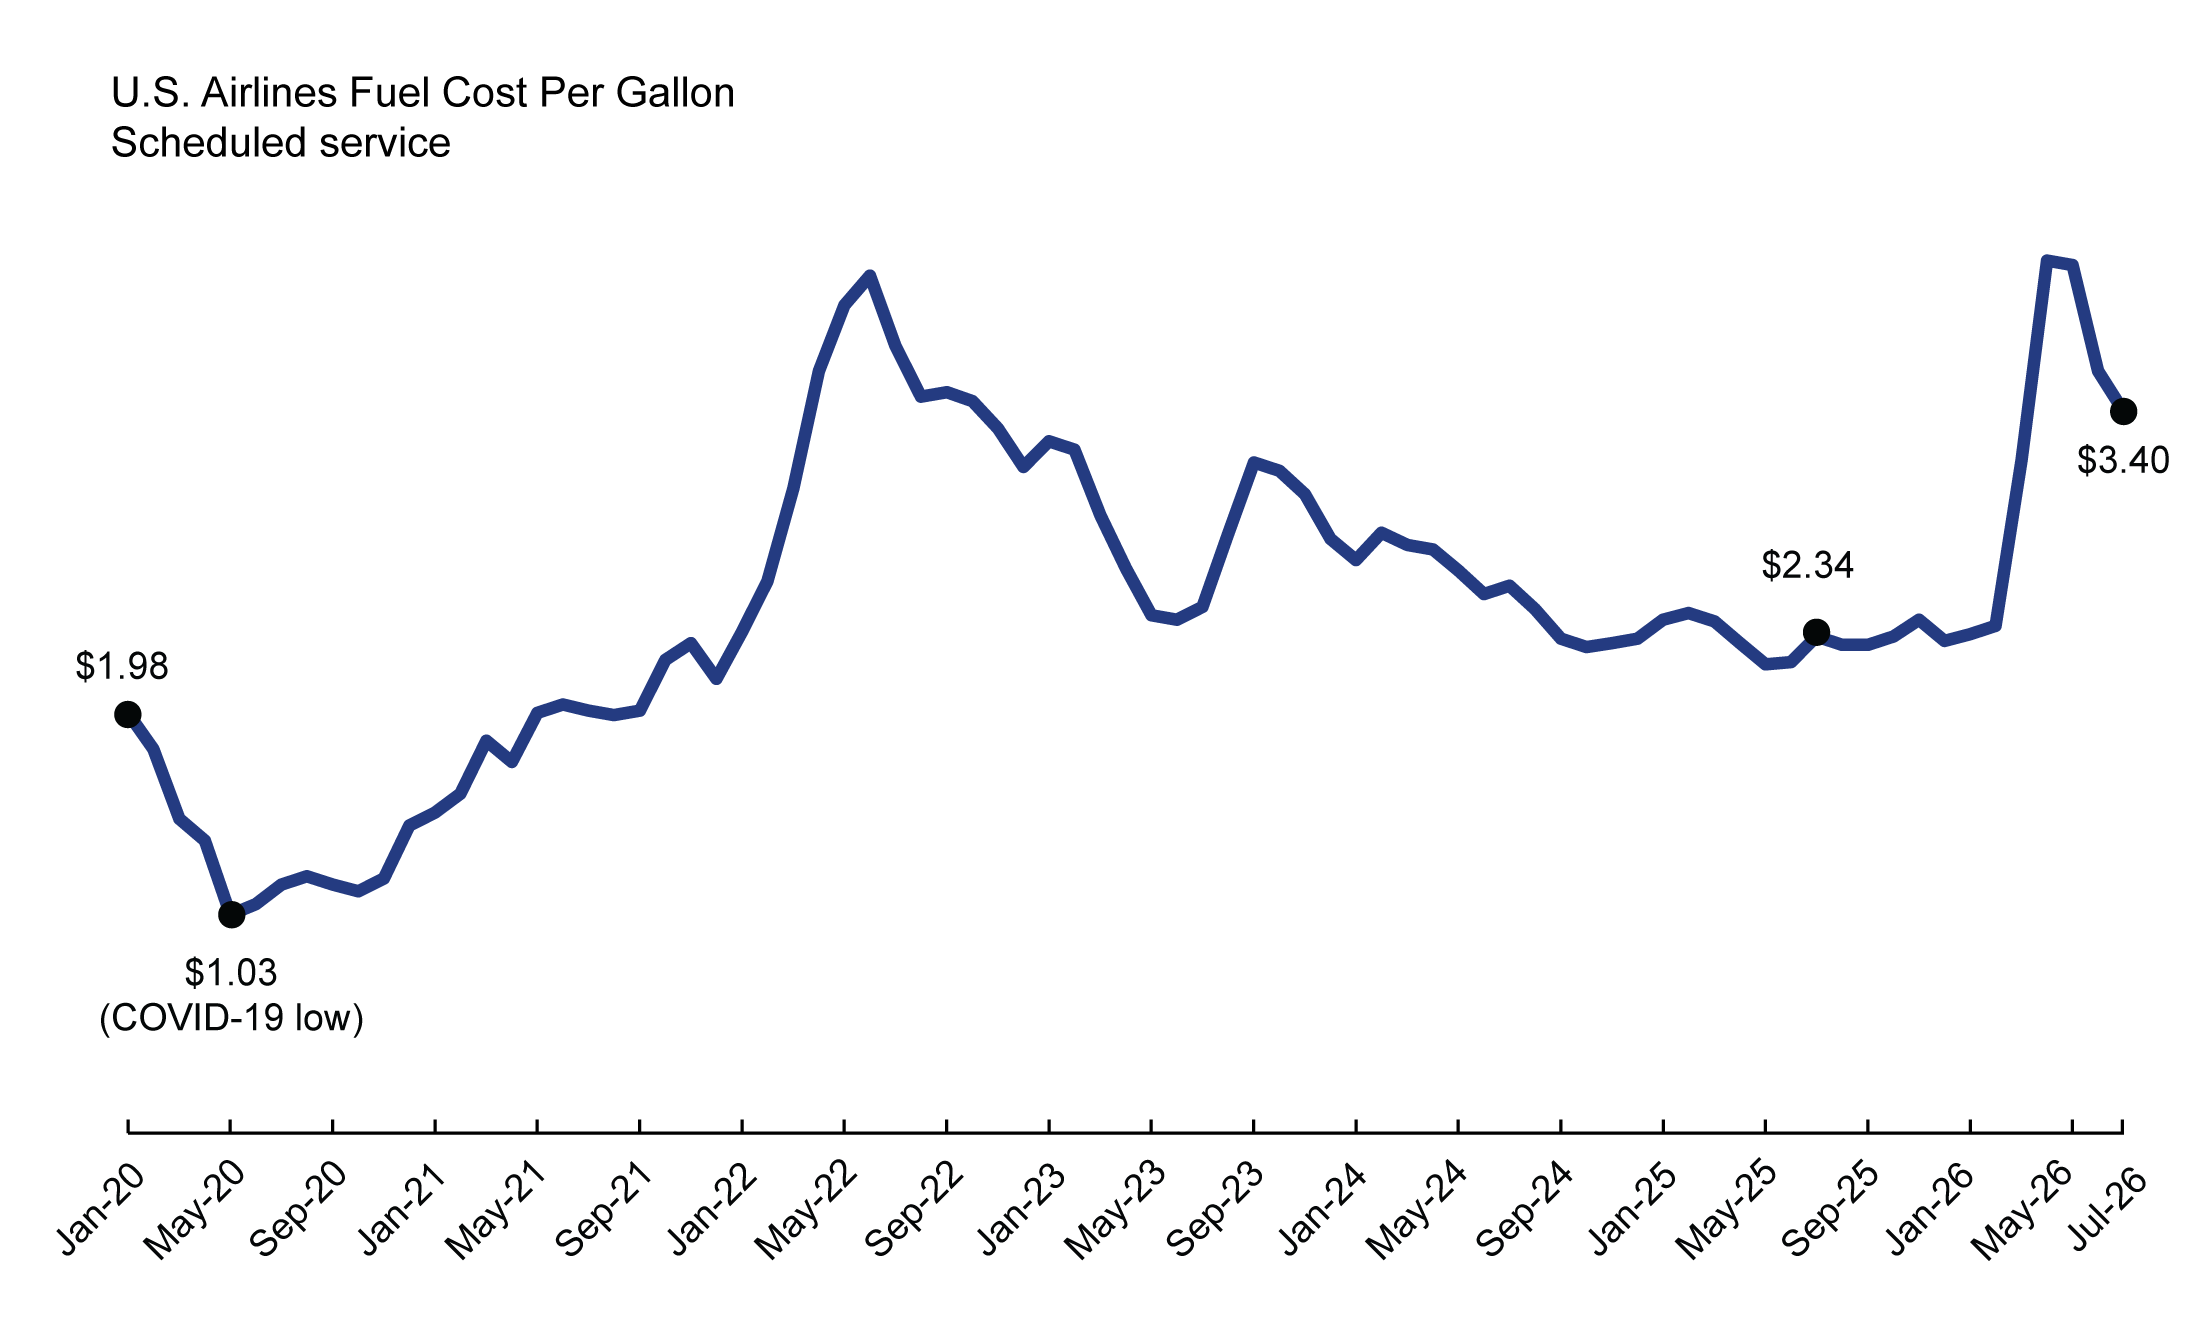
| Fuel cost per gallon for U.S. airlines (total) scheduled service | |
| July 2025 | $2.34 |
| June 2026 | $3.59 |
| July 2026 | $3.40 |
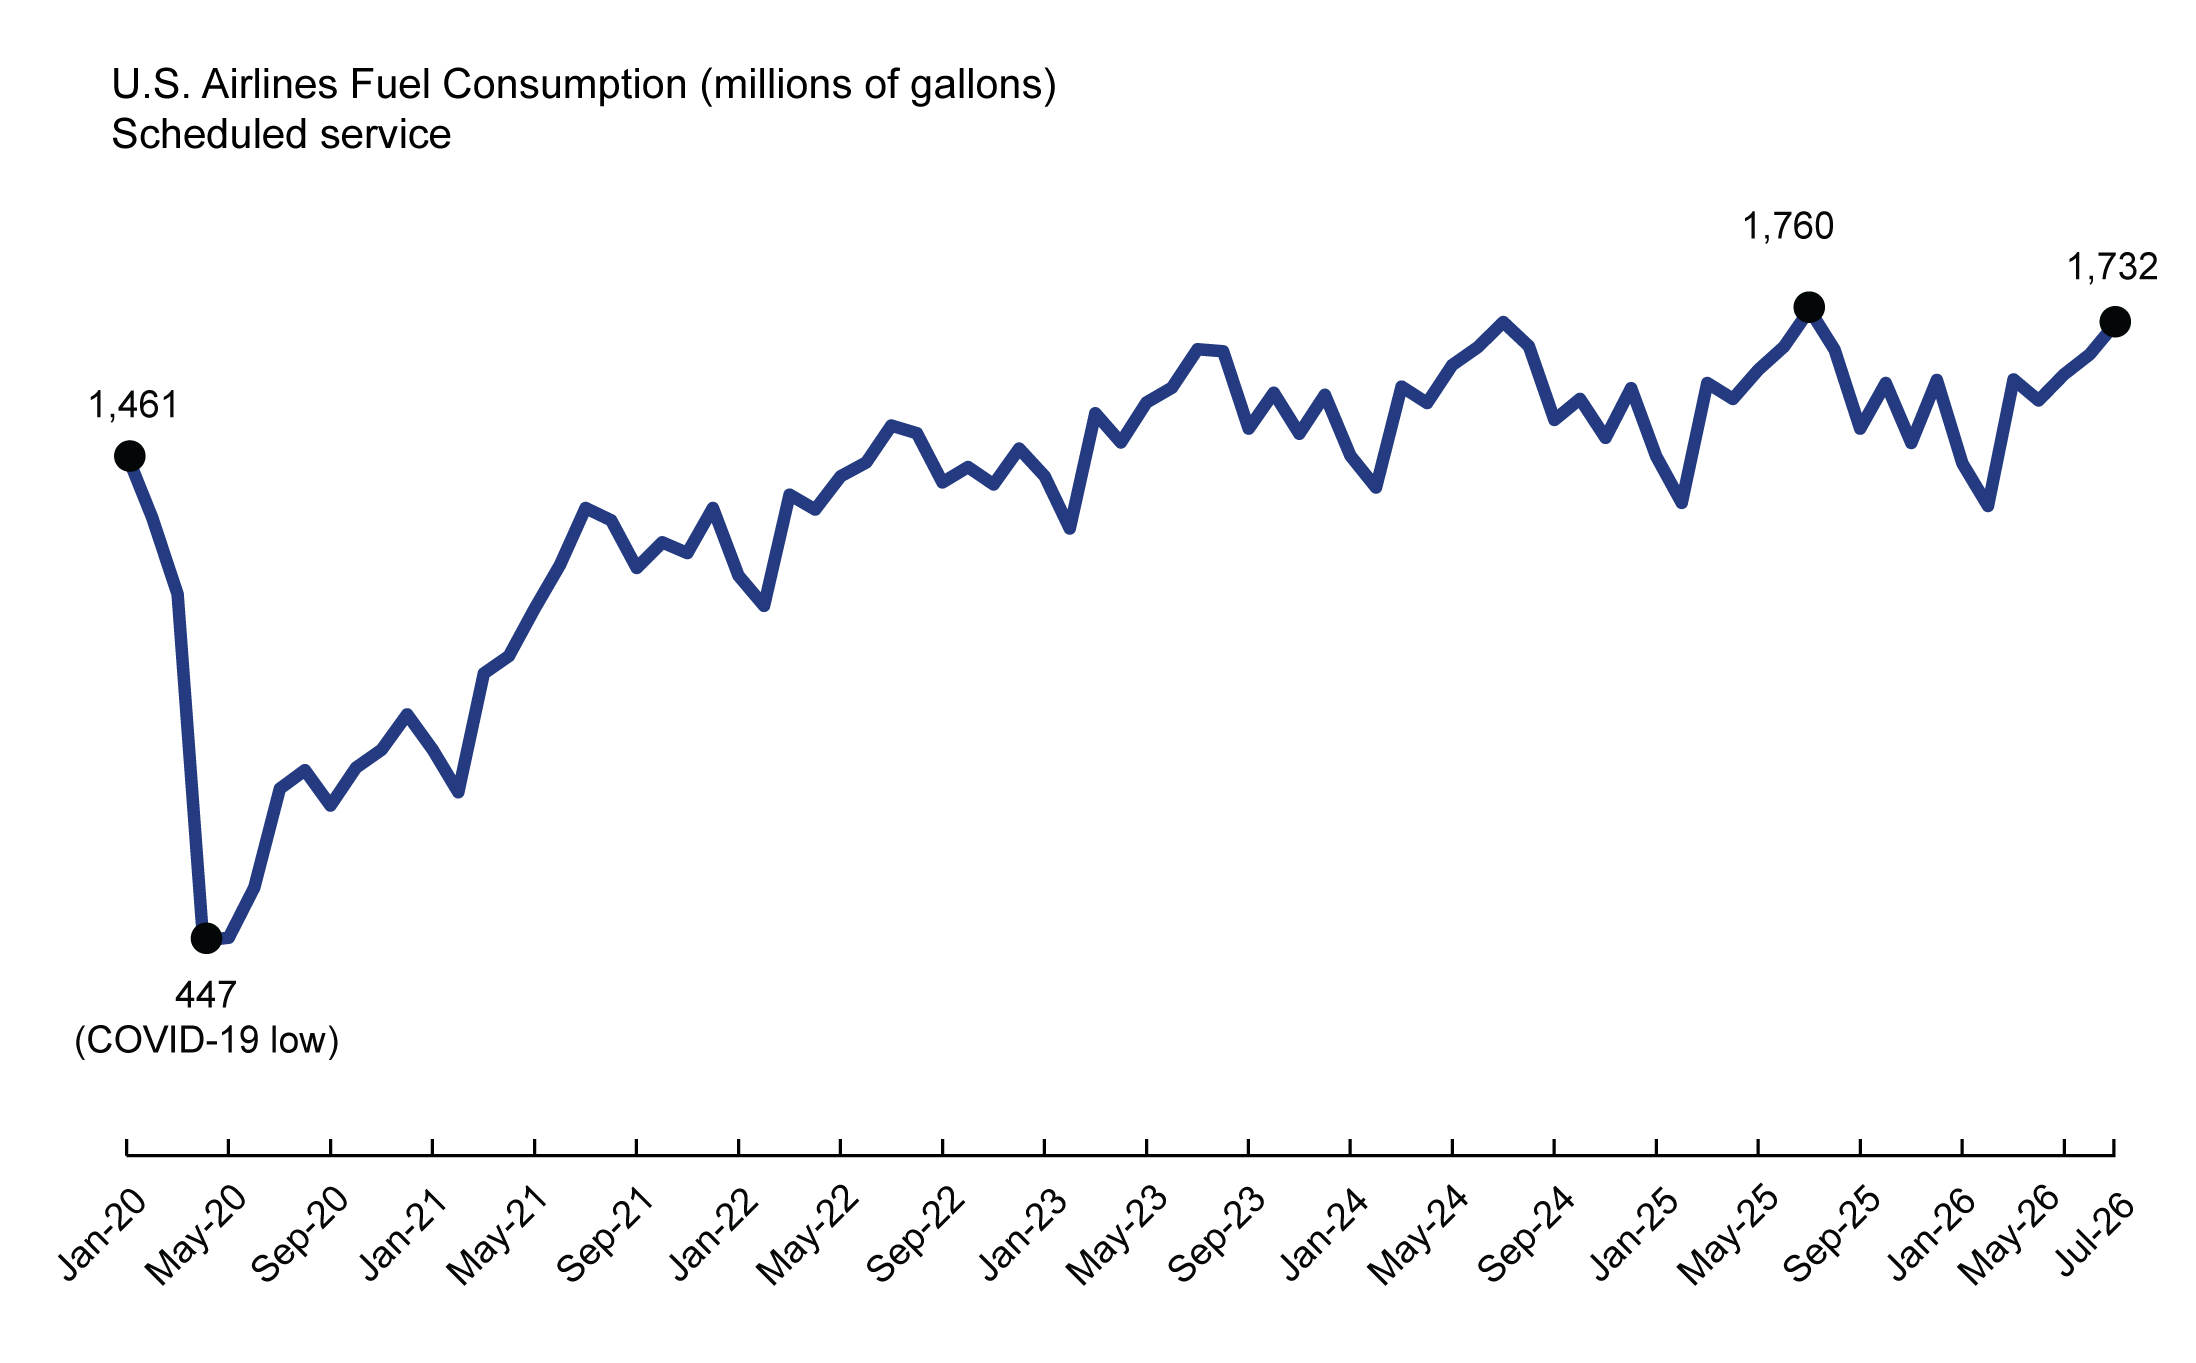
| Fuel consumed by U.S. airlines (total) scheduled service | |
| July 2025 | 1.76 billion gallons |
| June 2026 | 1.67 billion gallons |
| July 2026 | 1.73 billion gallons |
Fuel Cost and Consumption data from January 2000 to the present and Summaries by month are also available.
Airline fuel costs may be affected by hedging, contracts that allow airlines to limit exposure to future price changes. None of the cost numbers are adjusted for inflation. The month-to-month numbers are not seasonally adjusted.
Individual airline numbers through March 2026 are available on the BTS website.
Please Note:
The information provided within BTS statistical releases may not be based on 100% of the carriers required to report. Generally, data is released per schedule if reports have been received from at least 90% of the carriers, along with data from all the major carriers. Also, within text, percent change results may not be exact due to rounding.
To receive updates from BTS directly to your email, please consider subscribing to our GovDelivery service.