
U.S. Airlines October 2020 Passengers Decreased 62% from October 2019 (Preliminary)
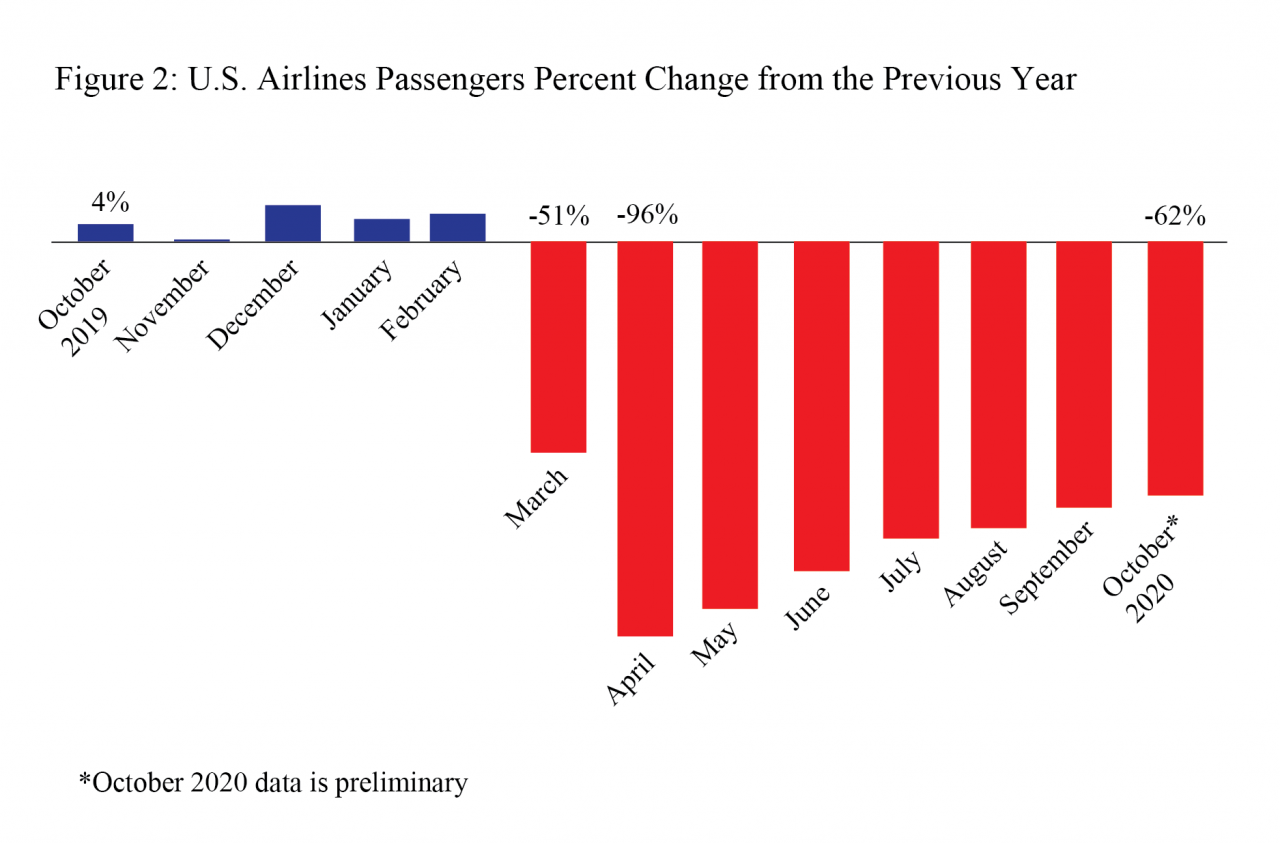
U.S. airlines carried 62% fewer scheduled service passengers in October 2020 than in October 2019 (preliminary), according to data filed with the Bureau of Transportation Statistics (BTS) by 22 airlines that carry more than 90% of the passengers. The 62% decline from October 2019 was the smallest year-to-year decrease since March.
The large airlines carried 29.9 million passengers in October 2020 (preliminary), compared to 78.3 million passengers in October 2019 and up from 3.0 million in April 2020, which was the lowest monthly total in BTS records dating back to 1974. The previous low was 14.6 million passengers in February 1975.
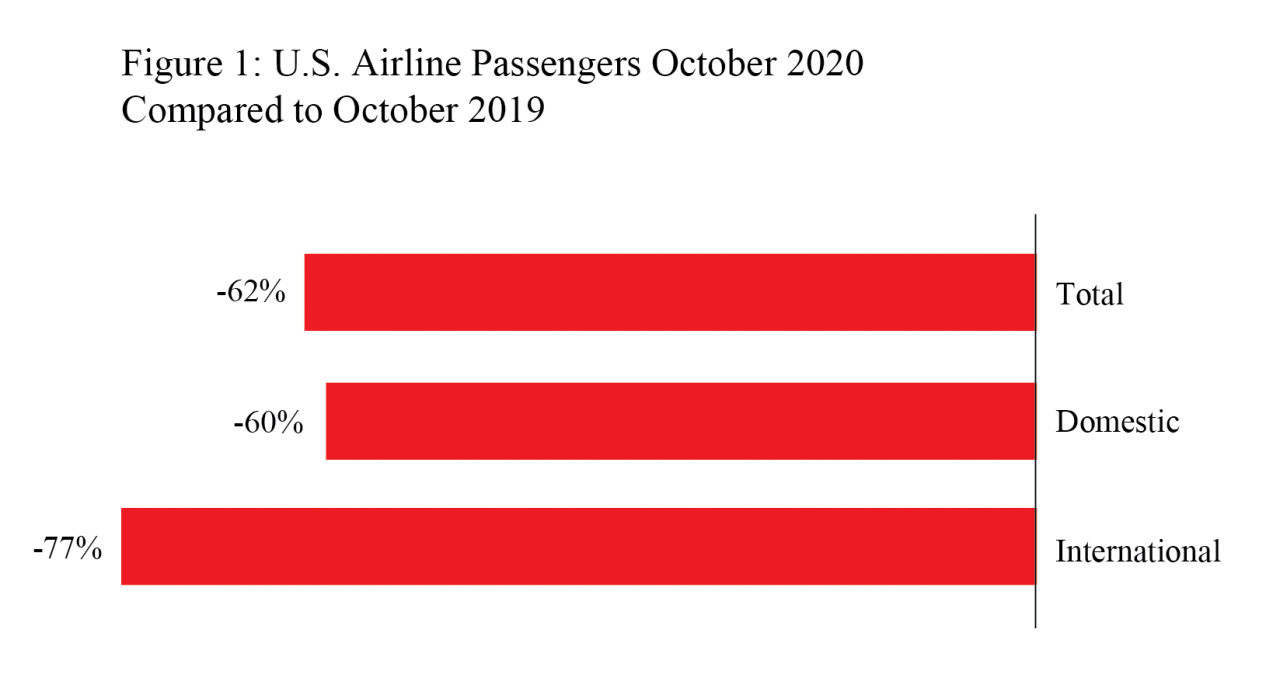
Preliminary October 2020 passenger numbers (22 carriers reporting):
- Total: 29.9 million passengers, down 62% from October 2019 (78.3M)
- Domestic: 27.9M passengers, down 60% from October 2019 (69.6M)
- International: 2.0M passengers, down 77% from October 2019 (8.7M)
U.S. airline traffic reports are filed monthly with BTS. Final October data will be released on Jan. 15. Complete international data by origin and destination, which is under a six-month confidentiality restriction, will be released on April 15.
Table 1: Systemwide Percent Change in US Airlines Scheduled Service Passengers from the Same Month of the Previous Year, 2016-2020
| 2016-2017 | 2017-2018 | 2018-2019 | 2019-2020 | |
|---|---|---|---|---|
| January | 3.0 | 2.9 | 4.0 | 5.6 |
| February | -0.2 | 5.7 | 3.0 | 6.7 |
| March | 3.4 | 4.6 | 5.1 | -51.3 |
| April | 4.5 | 4.8 | 3.8 | -96.1 |
| May | 3.0 | 4.9 | 5.2 | -89.6 |
| June | 3.4 | 5.0 | 3.7 | -80.3 |
| July | 3.8 | 5.2 | 3.6 | -72.4 |
| August | 5.0 | 5.0 | 3.4 | -69.8 |
| September | -2.3 | 5.8 | 5.7 | -65.2 |
| October | 4.6 | 3.9 | 4.1 | -61.8* |
| November | 4.6 | 4.5 | 0.5 | |
| December | 3.5 | 3.6 | 8.8 | |
| Annual | 3.1 | 4.7 | 4.2 |
| 2016-2017 | 2017-2018 | 2018-2019 | 2019-2020 | |
|---|---|---|---|---|
| January | 3.1 | 3.2 | 3.9 | 6.2 |
| February | -0.1 | 5.9 | 3.0 | 7.4 |
| March | 3.8 | 4.2 | 5.4 | -51.0 |
| April | 3.7 | 5.7 | 3.7 | -95.7 |
| May | 2.7 | 5.3 | 5.2 | -88.5 |
| June | 3.1 | 5.3 | 3.6 | -77.9 |
| July | 3.7 | 5.8 | 3.8 | -69.6 |
| August | 5.0 | 5.5 | 3.4 | -67.1 |
| September | -2.5 | 5.8 | 5.8 | -62.7 |
| October | 4.7 | 3.8 | 4.2 | -59.9* |
| November | 4.5 | 4.4 | 0.2 | |
| December | 3.7 | 3.7 | 9.5 | |
| Annual | 3.0 | 4.9 | 4.3 |
| 2016-2017 | 2017-2018 | 2018-2019 | 2019-2020 | |
|---|---|---|---|---|
| January | 2.1 | 1.0 | 4.5 | 1.9 |
| February | -1.2 | 4.6 | 3.4 | 0.7 |
| March | 0.4 | 7.2 | 3.1 | -53.3 |
| April | 9.8 | -1.0 | 4.3 | -98.6 |
| May | 5.4 | 2.3 | 5.3 | -98.1 |
| June | 5.3 | 3.4 | 4.2 | -96.4 |
| July | 4.6 | 1.6 | 2.2 | -90.4 |
| August | 4.9 | 2.0 | 3.9 | -87.5 |
| September | -1.1 | 5.9 | 4.6 | -83.7 |
| October | 3.2 | 4.3 | 3.2 | -77.3* |
| November | 5.4 | 4.7 | 2.2 | |
| December | 1.7 | 3.2 | 3.6 | |
| Annual | 3.5 | 3.1 | 3.8 |
Reporting Notes
Data are compiled from monthly reports filed with BTS by commercial U.S. air carriers detailing operations, passenger traffic and freight traffic. This release includes data received by BTS from U.S. airlines as of Dec. 3.
See the BTS Airlines and Airports page for additional U.S. airlines numbers through August for U.S. airlines. International data by origin and destination is available through May.
None of the data are from samples. Measures of statistical significance do not apply to the complete air traffic data.