U.S. Cargo and Passenger Airlines Added 2,058 Jobs in July 2023; Employment Remains 8.2% Above Pre-Pandemic July 2019
BTS 41-23

U.S. Airline Total Number of Employees (both Full-Time and Part-Time)
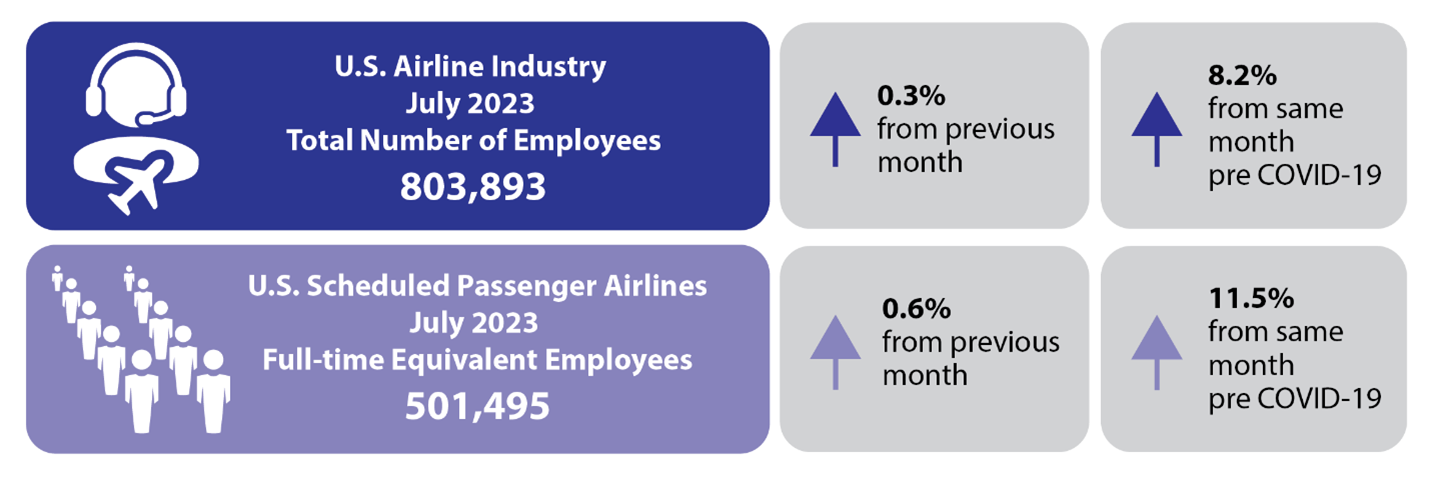
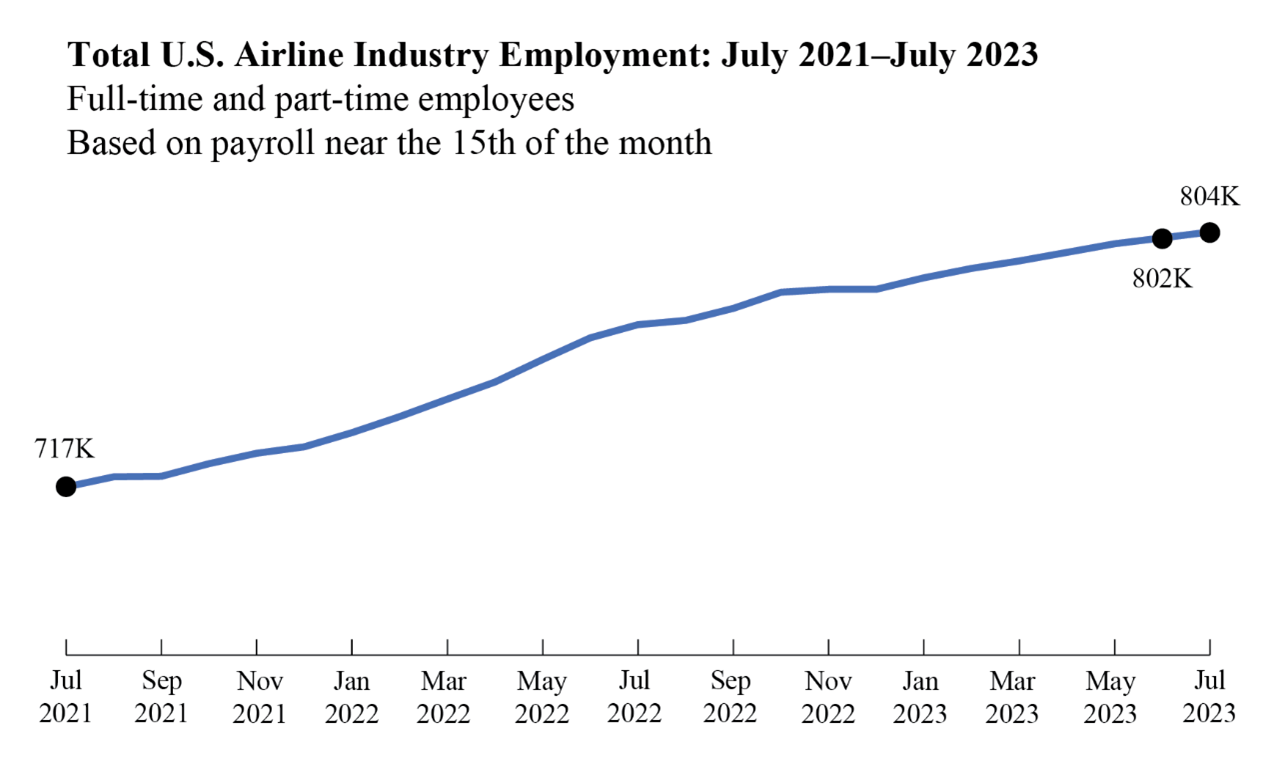
U.S. airline industry (passenger and cargo airlines combined) employment increased to 803,893 workers in July 2023, 2,058 (0.26%) more workers than in June 2023 (801,835) and 60,853 (8.19%) more than in pre-pandemic July 2019 (743,040).
U.S. scheduled-service passenger airlines employed 528,175 workers in July 2023 or 66% of the industry-wide total. Passenger airlines added 2,841 employees in July 2023 for a twenty-seventh consecutive month of job growth dating back to May 2021. Southwest led scheduled passenger carriers, adding 1,188 employees; United Air Lines added 927, and Delta Airlines added 545.
U.S. cargo airlines employed 270,963 workers in July 2023, 34% of the industry total. Cargo carriers lost 695 employees in July. FedEx, the leading air cargo employer, decreased employment by 687 jobs.

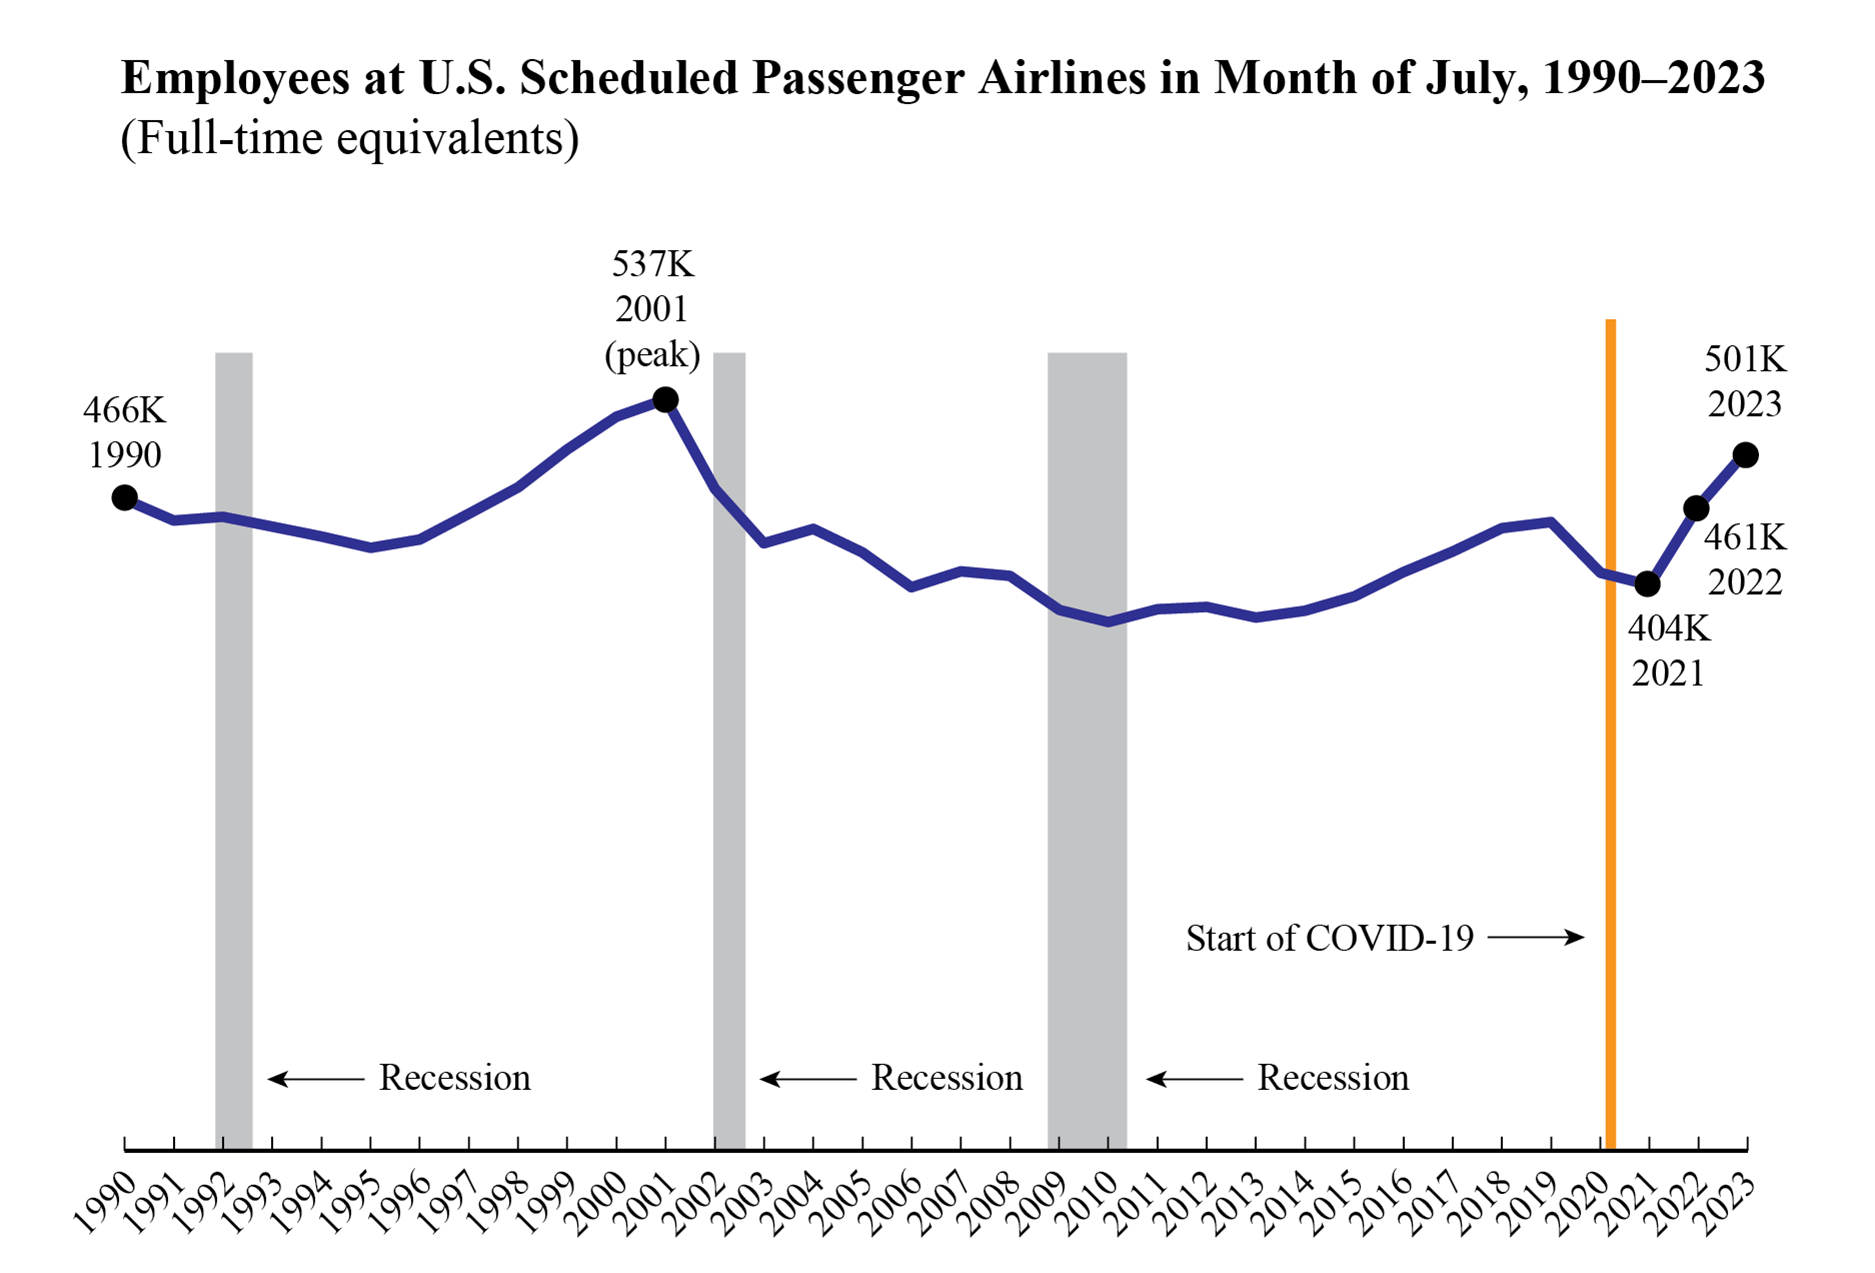
Scheduled passenger airlines add 2,987 full-time equivalents in July 2023 for 27th consecutive month of job growth
U.S. Airline Full-Time Equivalents (FTEs)
BTS calculates FTEs by dividing the number of part-time employees by 2 and adding that figure to the number of full-time employees. The July 2023 industry-wide numbers include 692,449 full-time and 111,444 part-time workers for a total of 748,171 FTEs, an increase from June of 1,900 FTEs (0.25%). July 2023’s total number of FTEs remains just 9.47% above pre-pandemic July 2019’s 683,459 FTEs.
The 26 U.S. scheduled passenger airlines reporting data for July 2023 employed 501,495 FTEs, 2,987 FTEs (0.60%) more than in June 2023. July 2023’s total number of scheduled passenger airline FTEs is 51,691 FTEs (11.49%) above pre-pandemic July 2019. Data by passenger carrier category can be found in the accompanying tables.
U.S. cargo airlines employed 242,010 FTEs in July 2023, down 988 FTEs (0.41%) from June 2023. U.S. cargo airlines have increased FTEs by 12,582 (5.48%) since pre-pandemic July 2019.

Reporting Notes
Data are compiled from monthly reports filed with BTS by commercial air carriers as of September 5, 2023. Additional airline employment data and previous releases can be found on the BTS website. The month-to-month numbers are not seasonally adjusted.
Passenger, cargo, and charter airlines that operate at least one aircraft that has more than 60 seats or the capacity to carry a payload of passengers, cargo, and fuel weighing more than 18,000 pounds must report monthly employment statistics. Regulations require U.S. airlines to report employment numbers for employees who worked or received pay for any part of the pay period(s) ending nearest the 15th day of the month.
See the tables that accompany this release on the BTS website for detailed data (Tables 1-15) and industry summary monthly data since 1990. Additional individual airline numbers are available on the BTS airline employment web page. The web page provides full-time and part-time employment numbers by carrier by month from 1990 through July 2023.
Missing carriers: 2HQ (Elite Airways).
The next update for U.S. airline employment is scheduled for Tuesday, October 10, 2023.
