
U.S. Scheduled Service Airline 2021 Passengers Increased 83% from 2020, Decreased 27% from Pre-pandemic 2019 (Preliminary)
BTS 08-22
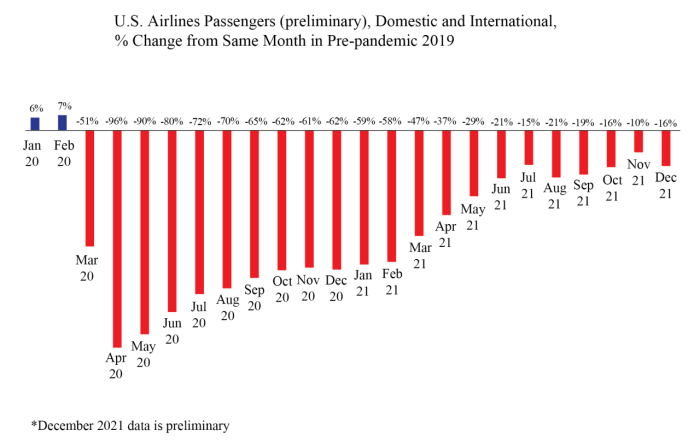
December 2021 Passenger Enplanements up 118% from December 2020, down 16% from December 2019
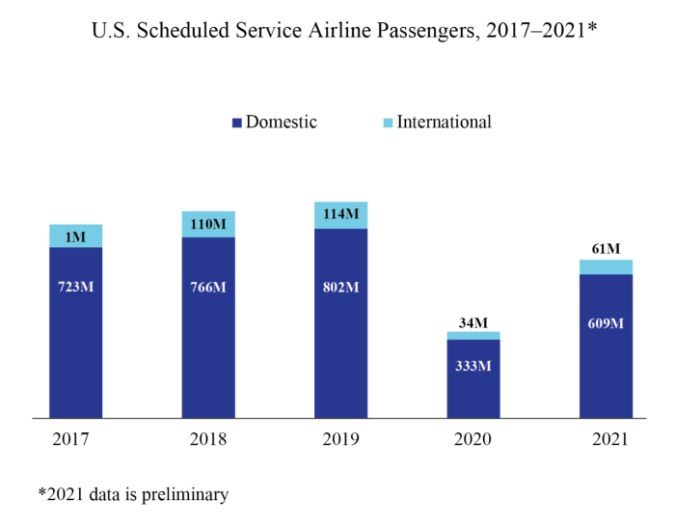
For the calendar year 2021, U.S. scheduled service airlines carried 670.4M passengers (preliminary), an increase of 303.6M passengers (83%) from 2020 and a decrease of 245.9M passengers (27%) from pre-pandemic 2019. In 2019, the last full calendar year before the onset of COVID-19, domestic flights accounted for 88% of all passengers, and international flights accounted for 12%. In 2021, domestic flights accounted for 91% of all passengers, and international flights accounted for 9%.
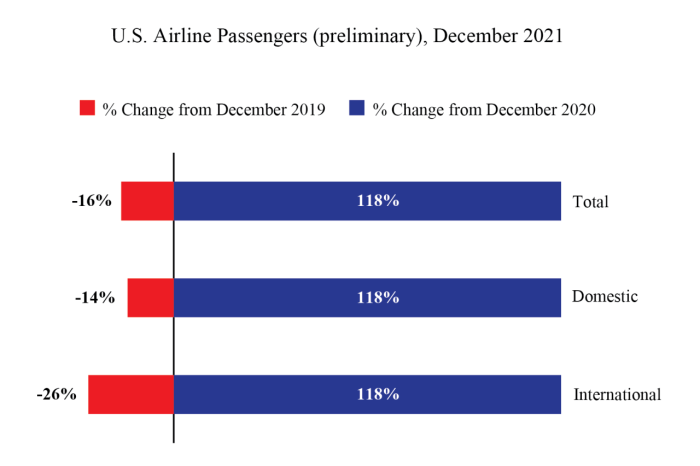
U.S. airlines carried 66.3 million scheduled service passengers in December 2021 (preliminary), 118% more than in December 2020 and 16% fewer than in pre-pandemic December 2019, according to data filed with the Bureau of Transportation Statistics (BTS) by 23 airlines that carry more than 90% of the passengers. Domestic passengers (66.3 million) made up 89% of total enplanements, and international passengers (7.1 million) accounted for 11% of total enplanements.
Systemwide Passengers
- December 2021 passengers: 66.3M
- Change from December 2020: 118%
- Change from pre-pandemic December 2019: -16%
- Change from April 2020 low: +63.3M
Table 1: Systemwide Percent Change in US Airlines Scheduled Service Passengers from the Same Month of the Previous Year, 2017-2021
|
Year-to-Year Percent Change |
||||
|
|
2017 - 2018 |
2018 - 2019 |
2019 - 2020 |
2020 - 2021 |
|
January |
3.0 |
5.2 |
5.9 |
-50.5 |
|
February |
5.9 |
4.2 |
7.0 |
-60.6 |
|
March |
4.6 |
6.3 |
-51.1 |
9.9 |
|
April |
6.0 |
3.8 |
-96.0 |
1492.6 |
|
May |
6.0 |
5.3 |
-90.0 |
617.3 |
|
June |
6.2 |
3.7 |
-80.1 |
300.3 |
|
July |
6.4 |
3.6 |
-72.2 |
206.7 |
|
August |
6.2 |
3.5 |
-69.6 |
164.6 |
|
September |
7.1 |
5.8 |
-65.0 |
132.5 |
|
October |
5.0 |
4.3 |
-61.6 |
119.5 |
|
November |
5.7 |
0.7 |
-60.4 |
128.5 |
|
December |
4.8 |
9.2 |
-61.3 |
118.0* |
|
Annual |
5.6 |
4.6 |
-60.0 |
82.8 |
Source: Bureau of Transportation Statistics, T-100 Market
* December 2021 data is preliminary
Domestic Passengers
- December 2021 passengers: 59.2M
- Change from December 2020: 118%
- Change from pre-pandemic December 2019: -14%
- Change from April 2020 low: +56.3M passengers
- Domestic percent of total December 2021 passengers: 89%
- Domestic percent of total December 2019 passengers: 88%
Table 2: Domestic Percent Change in US Airlines Scheduled Service Passengers from the Same Month of the Previous Year, 2017-2021
|
Year-to-Year Percent Change |
||||
|
|
2017 - 2018 |
2018 - 2019 |
2019 - 2020 |
2020 - 2021 |
|
January |
3.3 |
5.2 |
6.5 |
-50.5 |
|
February |
6.0 |
4.2 |
7.8 |
-58.9 |
|
March |
4.3 |
6.7 |
-50.8 |
14.7 |
|
April |
7.0 |
3.7 |
-95.7 |
1426.7 |
|
May |
6.6 |
5.2 |
-88.9 |
571.6 |
|
June |
6.7 |
3.6 |
-77.7 |
272.8 |
|
July |
7.2 |
3.8 |
-69.3 |
191.1 |
|
August |
6.9 |
3.5 |
-66.9 |
153.3 |
|
September |
7.2 |
5.9 |
-62.5 |
125.8 |
|
October |
5.0 |
4.4 |
-59.7 |
115.8 |
|
November |
5.8 |
0.5 |
-59.2 |
127.0 |
|
December |
5.0 |
9.9 |
-60.7 |
118.0* |
|
Annual |
6.0 |
4.7 |
-58.5 |
82.9 |
Source: Bureau of Transportation Statistics, T-100 Domestic Market
*December 2021 data is preliminary
International Passengers
- December 2021 passengers: 7.1M
- Change from December 2020: 118%
- Change from pre-pandemic December 2019: -26%
- Change from April 2020 low: +6.9M
- International percent of total December 2021 passengers: 11%
- International percent of total December 2020 passengers: 12%
Table 3: International Percent Change in US Airlines Scheduled Service Passengers from the Same Month of the Previous Year, 2017-2021
|
Year-to-Year Percent Change |
||||
|
|
2017 - 2018 |
2018 - 2019 |
2019 - 2020 |
2020 - 2021 |
|
January |
1.3 |
4.7 |
2.5 |
-50.6 |
|
February |
4.8 |
3.7 |
1.4 |
-73.3 |
|
March |
7.3 |
3.7 |
-53.1 |
-25.6 |
|
April |
-0.8 |
4.7 |
-98.6 |
2,924.5 |
|
May |
2.4 |
5.7 |
-98.1 |
2,530.0 |
|
June |
3.3 |
4.3 |
-96.4 |
1,414.6 |
|
July |
1.7 |
2.4 |
-90.3 |
525.8 |
|
August |
2.3 |
4.1 |
-87.4 |
360.0 |
|
September |
6.1 |
4.9 |
-83.6 |
245.1 |
|
October |
4.5 |
3.5 |
-77.1 |
171.7 |
|
November |
4.9 |
2.5 |
-70.1 |
144.5 |
|
December |
3.5 |
4.3 |
-65.9 |
117.8* |
|
Annual |
3.3 |
4.0 |
-70.3 |
81.5 |
Source: Bureau of Transportation Statistics, T-100 International Market
*December 2021 data is preliminary
Reporting Notes
U.S. airline traffic reports detailing operations, passenger traffic and freight traffic are filed monthly with BTS by commercial U.S. carriers. This release includes data received by BTS from U.S. scheduled passenger service airlines as of February 8, 2022. None of the data are from samples. Measures of statistical significance do not apply to the complete air traffic data.
Final December data will be released on March 10. Complete international data by origin and destination, which is under a six-month confidentiality restriction, will be released on June 9.
See the BTS Airlines and Airport page for additional U.S. airlines numbers through October for U.S. airlines. International data by origin and destination is available through July.