
US Airlines net profit was $6.7 billion in 2024, a decrease over 2023
BTS 28-25
This release is published on a fixed schedule as required by the Office of Management and Budget, and statistics in this release may be revised when inputs to the statistics are corrected or updated. Data on the program page of this website are the most up-to-date and complete. All costs are in current dollars.
U.S. scheduled passenger airlines reported a 2024 after-tax net profit of $6.7 billion and a pre-tax operating profit of $13.5 billion.
U.S. airline financial reports are filed quarterly with the Bureau of Transportation Statistics (BTS). See the tables that accompany this release on the BTS website for additional 2024 annual (Tables 1-6) and fourth-quarter (Tables 7-12) financial results.
2024 Annual Results for All 25 Scheduled U.S. Passenger Airlines
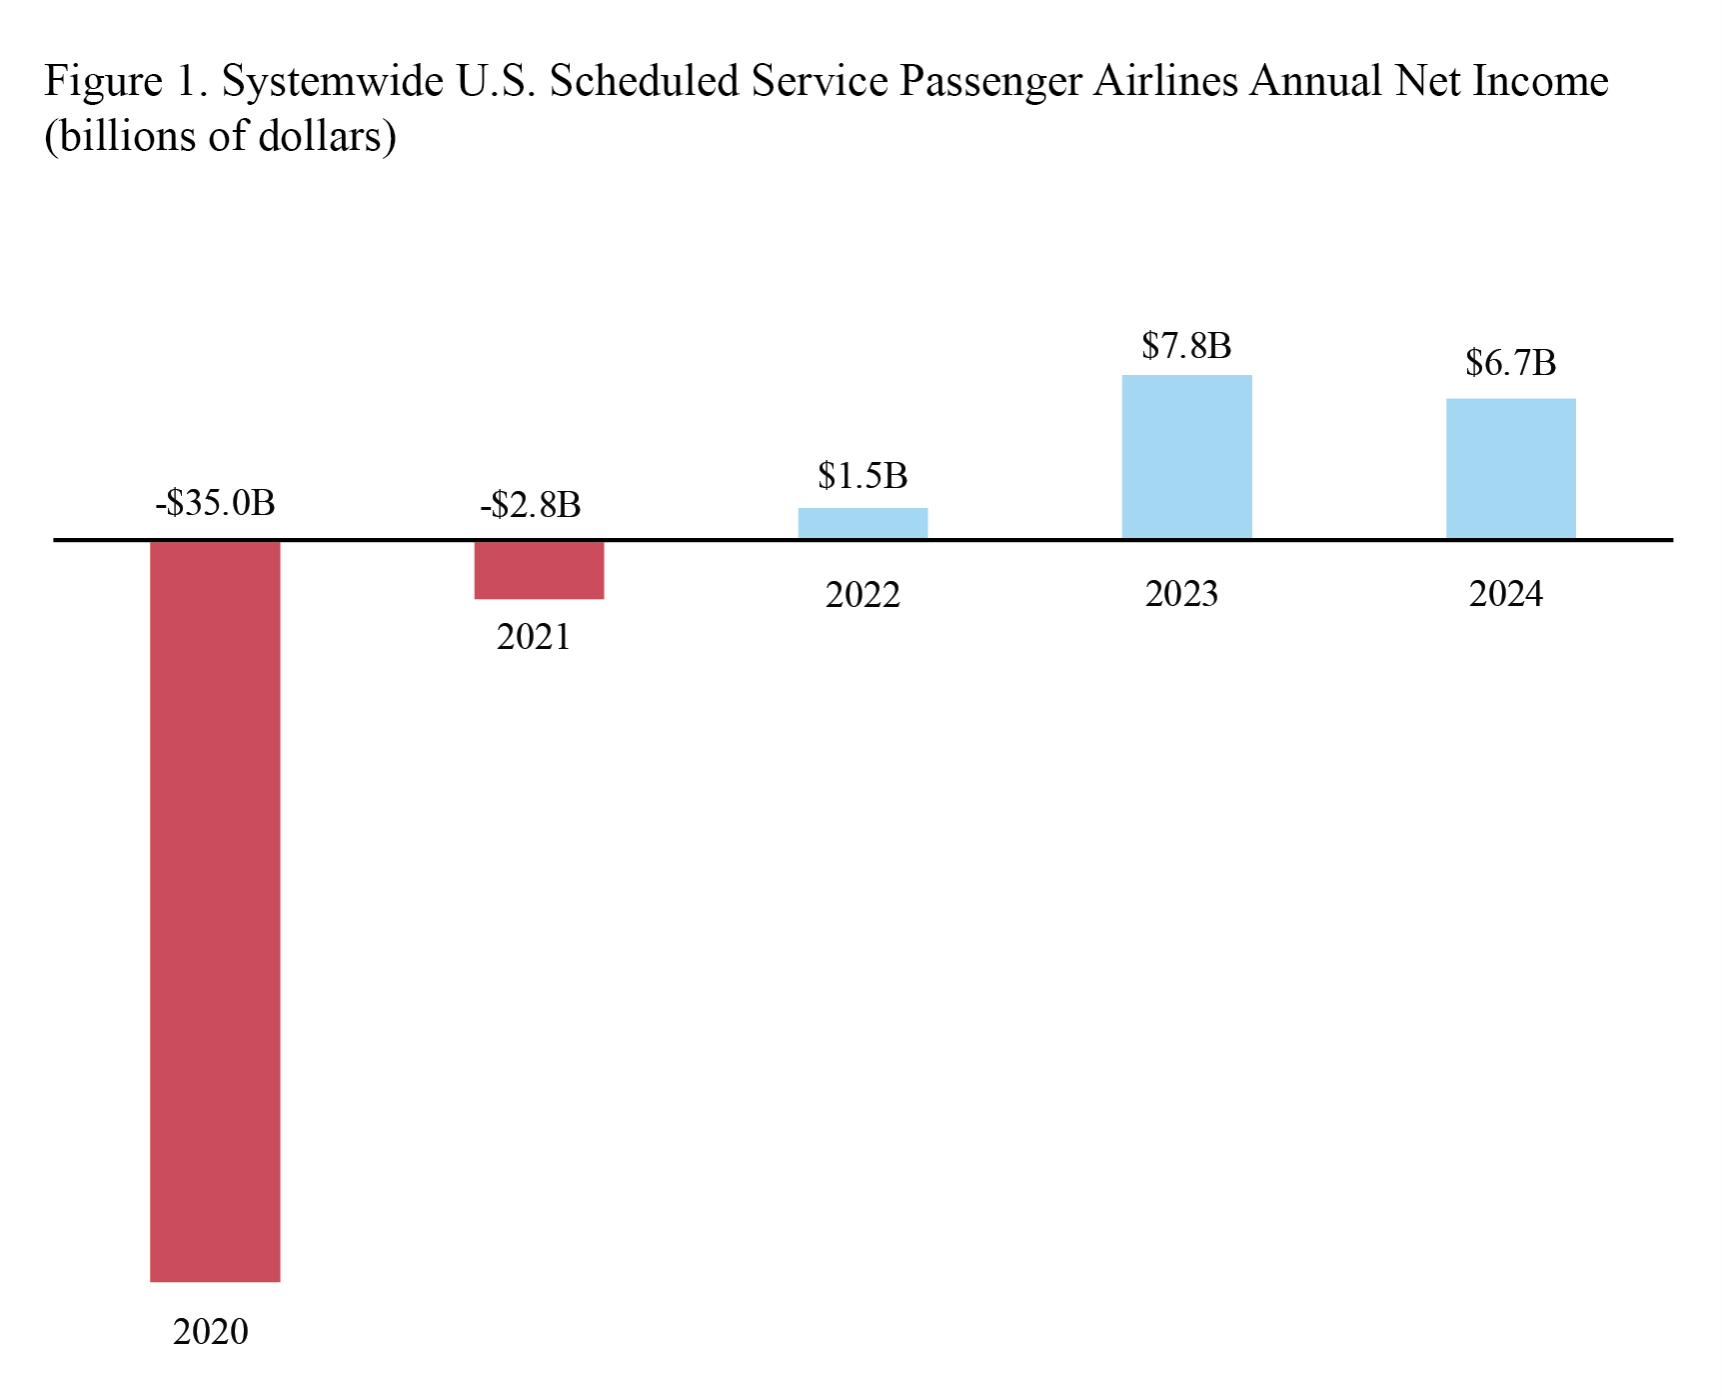
After-tax net income
- $6.7 billion profit in 2024
- Compared to $7.8 billion profit in 2023
Pre-tax operating profit/loss
- $13.5 billion profit in 2024
- Compared to $13.2 billion profit in 2023
- Total 2024 operating revenue: $247.2 billion
- Share of total 2024 operating revenue:
- Fares: $185.3 billion, 75.0% compared to 75.8% in 2023
- Baggage fees: $7.3 billion, 2.9% compared to 3.0% in 2023
- Reservation change fees: $1.0 billion, 0.4% compared to 0.4% in 2023
- Share of total 2024 operating revenue:
Fees are included for calculations of net income, operating revenue and operating profit or loss.
Total 2024 operating expenses: $233.7 billion
- Share of total 2024 operating expenses:
- Fares: $43.9 billion, 18.8% compared to 21.3% in 2023
- Labor: $85.1 billion, 36.4% compared to 34.8% in 2023
Domestic results for 25 scheduled airlines
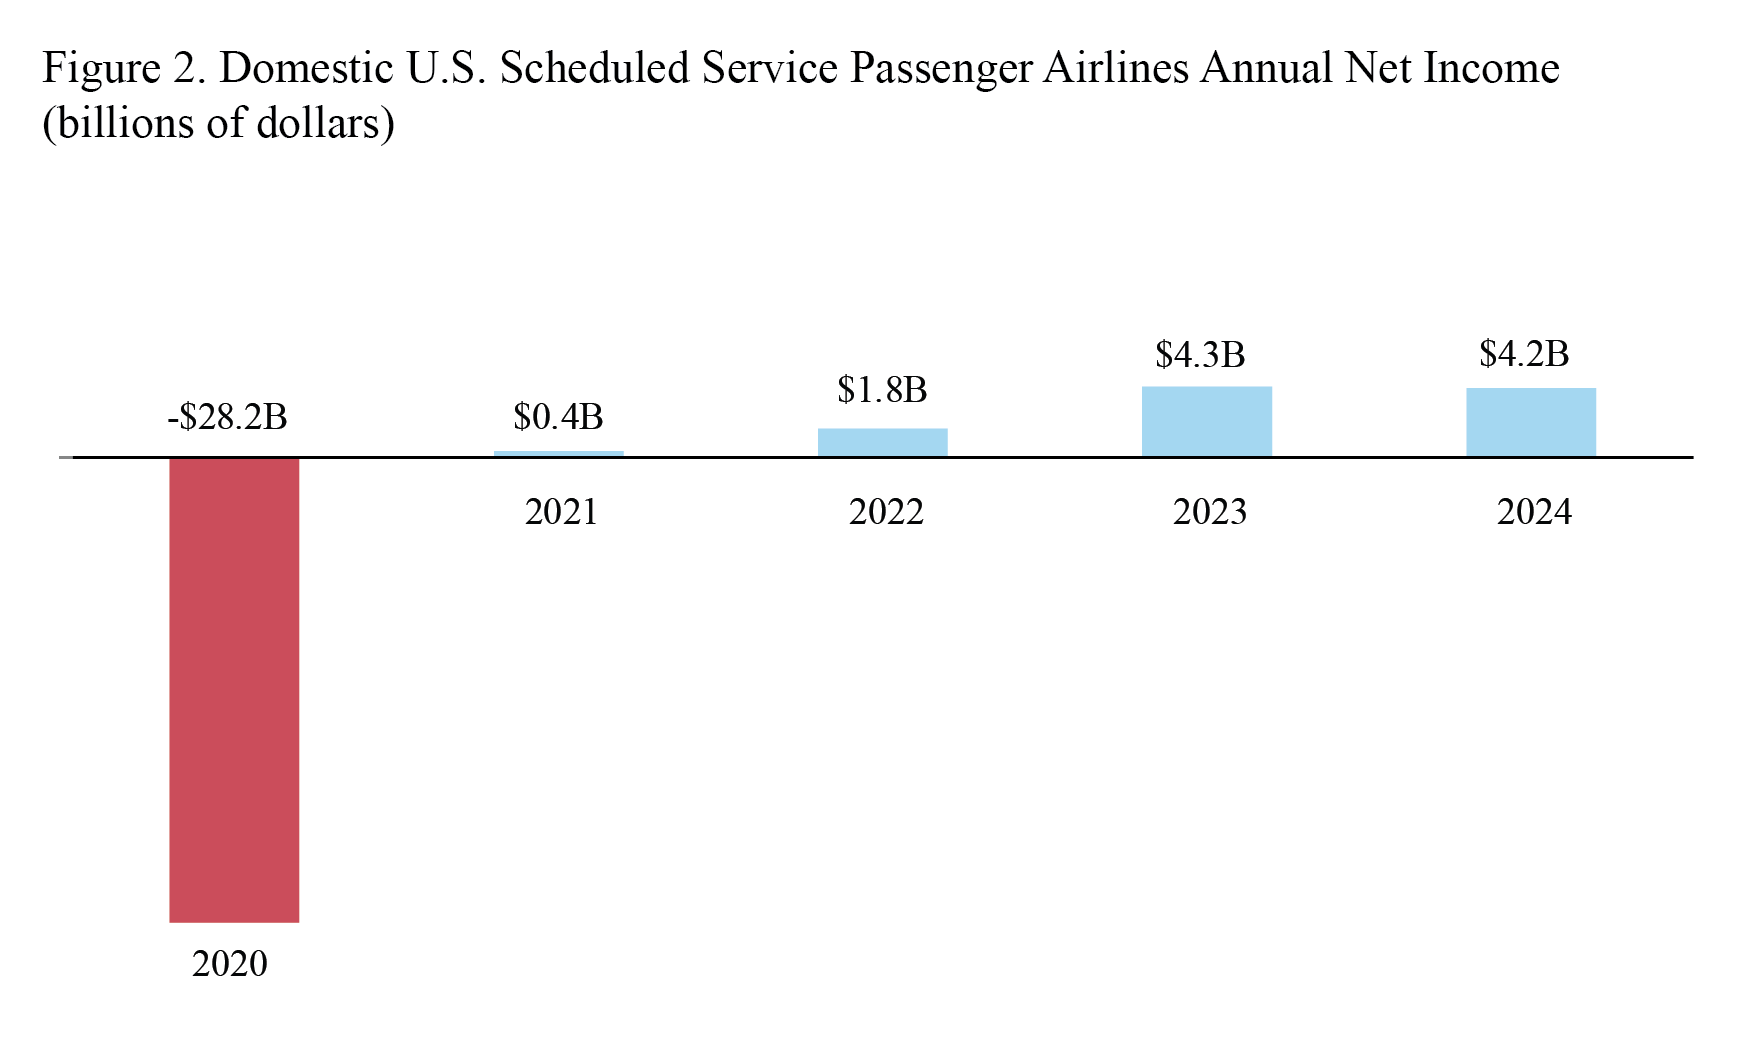
After-tax domestic net income
- $4.2 billion profit in 2024
- Compared to $4.3 billion profit in 2023
Pre-tax domestic operating profit/loss
- $9.2 billion profit in 2024
- Compared to $8.4 billion profit in 2023
- 2024 domestic operating revenue: $184.0 billion
- Share of total 2024 domestic operating revenue:
- Fares: $132.2 billion, 71.9%, compared to 73.1% in 2023
- Baggage fees: $5.8 billion, 3.2%, compared to 3.2% in 2023
- Reservation change fees: $850 million, 0.5%, compared to 0.5% in 2023
- Share of total 2024 domestic operating revenue:
Fees are included for calculations of net income, operating revenue and operating profit or loss.
- 2024 domestic operating expenses: $174.9 billion
- Share of total 2024 domestic operating expenses:
- Fuel: $29.9 billion, 17.1%, compared to 19.7% in 2023
- Labor: $63.5 billion, 36.3%, compared to 34.7% in 2023
- Share of total 2024 domestic operating expenses:
International results for 20 scheduled U.S. airlines
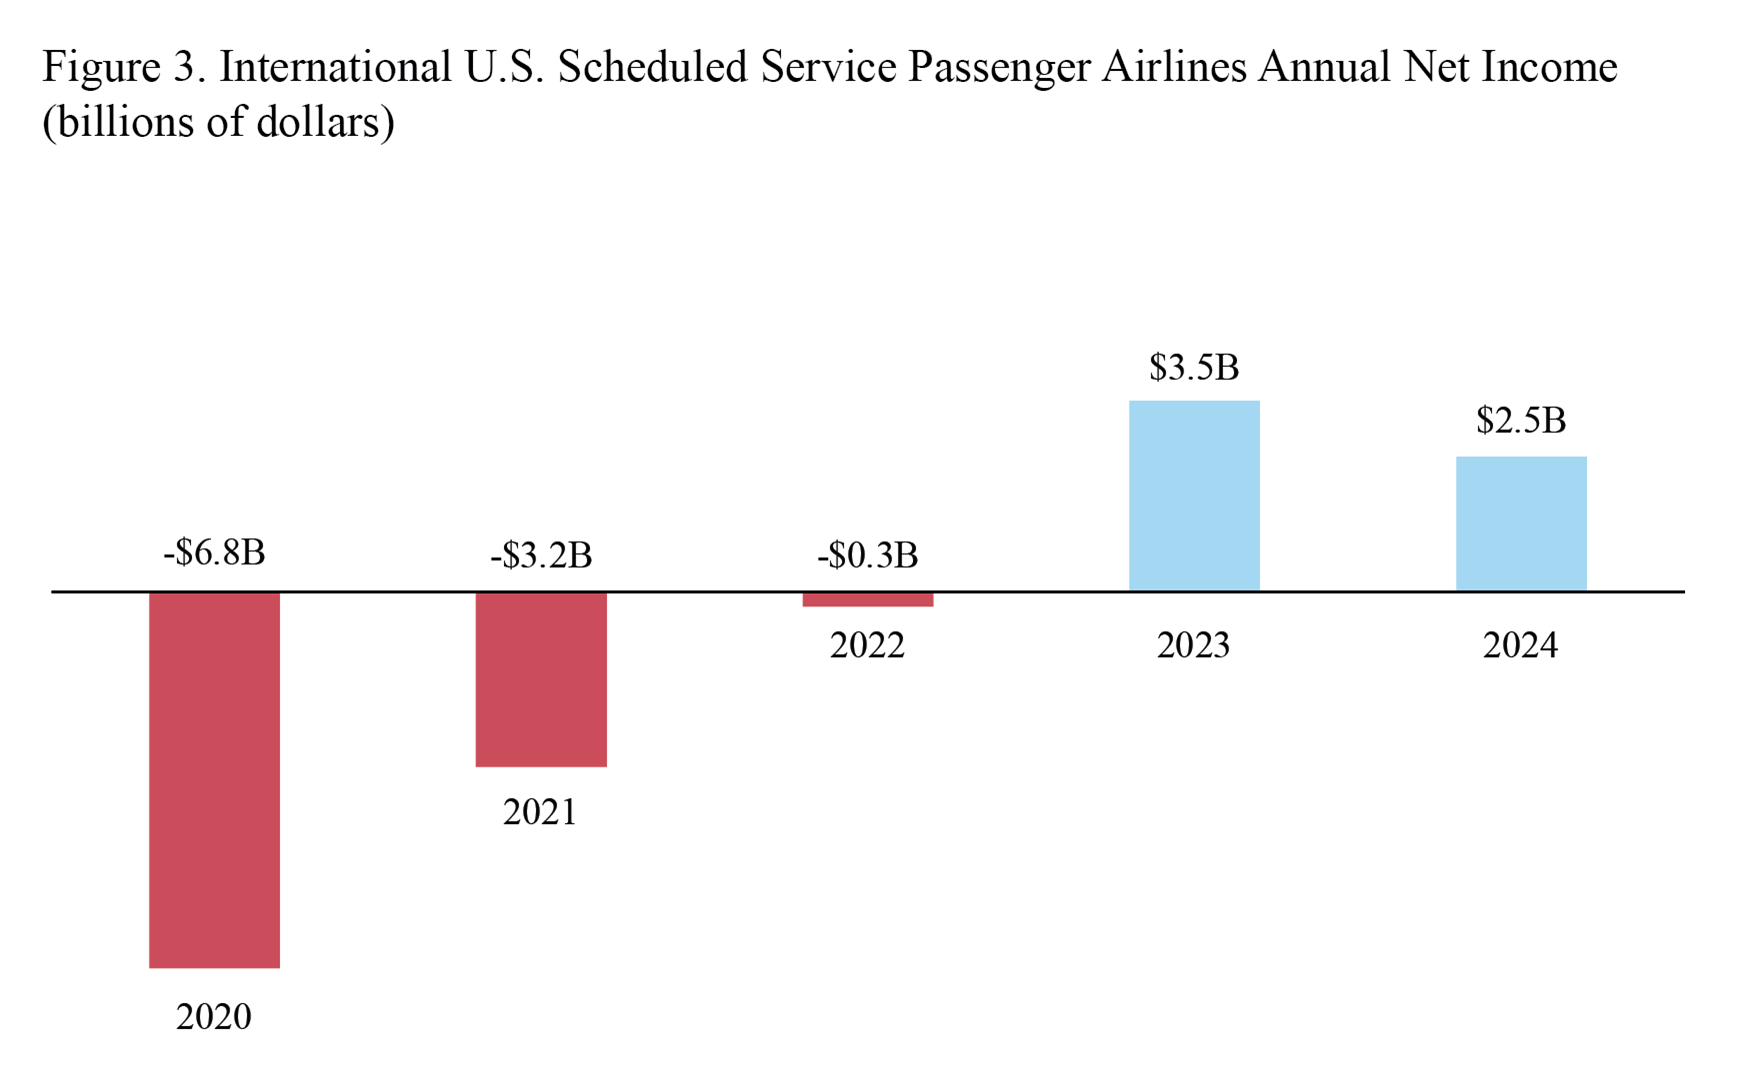
After-tax international net income
- $2.5 billion profit in 2024
- Compared to $3.5 billion profit in 2023
Pre-tax international operating profit
- $4.4 billion profit in 2024
- Compared to $4.8 billion profit in 2023
- 2024 international operating revenue: $63.2 billion
- Share of total 2024 international operating revenue:
- Fares: $53.1 billion, 84.0%, compared to 83.9% in 2023
- Baggage fees: $1.4 billion, 2.3%, compared to 2.3% in 2023
- Reservation change fees: $172 million, 0.3%, compared to 0.3% in 2023
- Share of total 2024 international operating revenue:
Fees are included for calculations of net income, operating revenue and operating profit or loss.
- 2024 international operating expenses: $58.8 billion
- Share of total 2024 international operating expenses:
- Fuel: $14.0 billion, 23.7%, compared to 26.3% in 2023
- Labor: $21.6 billion, 36.8%, compared to 34.8% in 2023
- Share of total 2024 international operating expenses:
2024 Margins
Net margin is the net income or loss as a percentage of operating revenue. Operating margin is the operating profit or loss as a percentage of operating revenue.
Systemwide:
Net income margin:
- 2.7% in 2024
- Compared to 3.3% in 2023
Operating margin:
- 5.5% in 2024
- Compared to 5.6% in 2023
Domestic
Net income margin:
- 2.3% in 2024
- Compared to 2.4% in 2023
Operating margin:
- 5.0% in 2024
- Compared to 4.8% in 2023
International
Net income margin:
- 3.9% in 2024
- Compared to 5.8% in 2023
Operating margin:
- 6.9% in 2024
- Compared to 8.0% in 2023
4Q 2024 Results for All 24 Scheduled U.S. Passenger Airlines
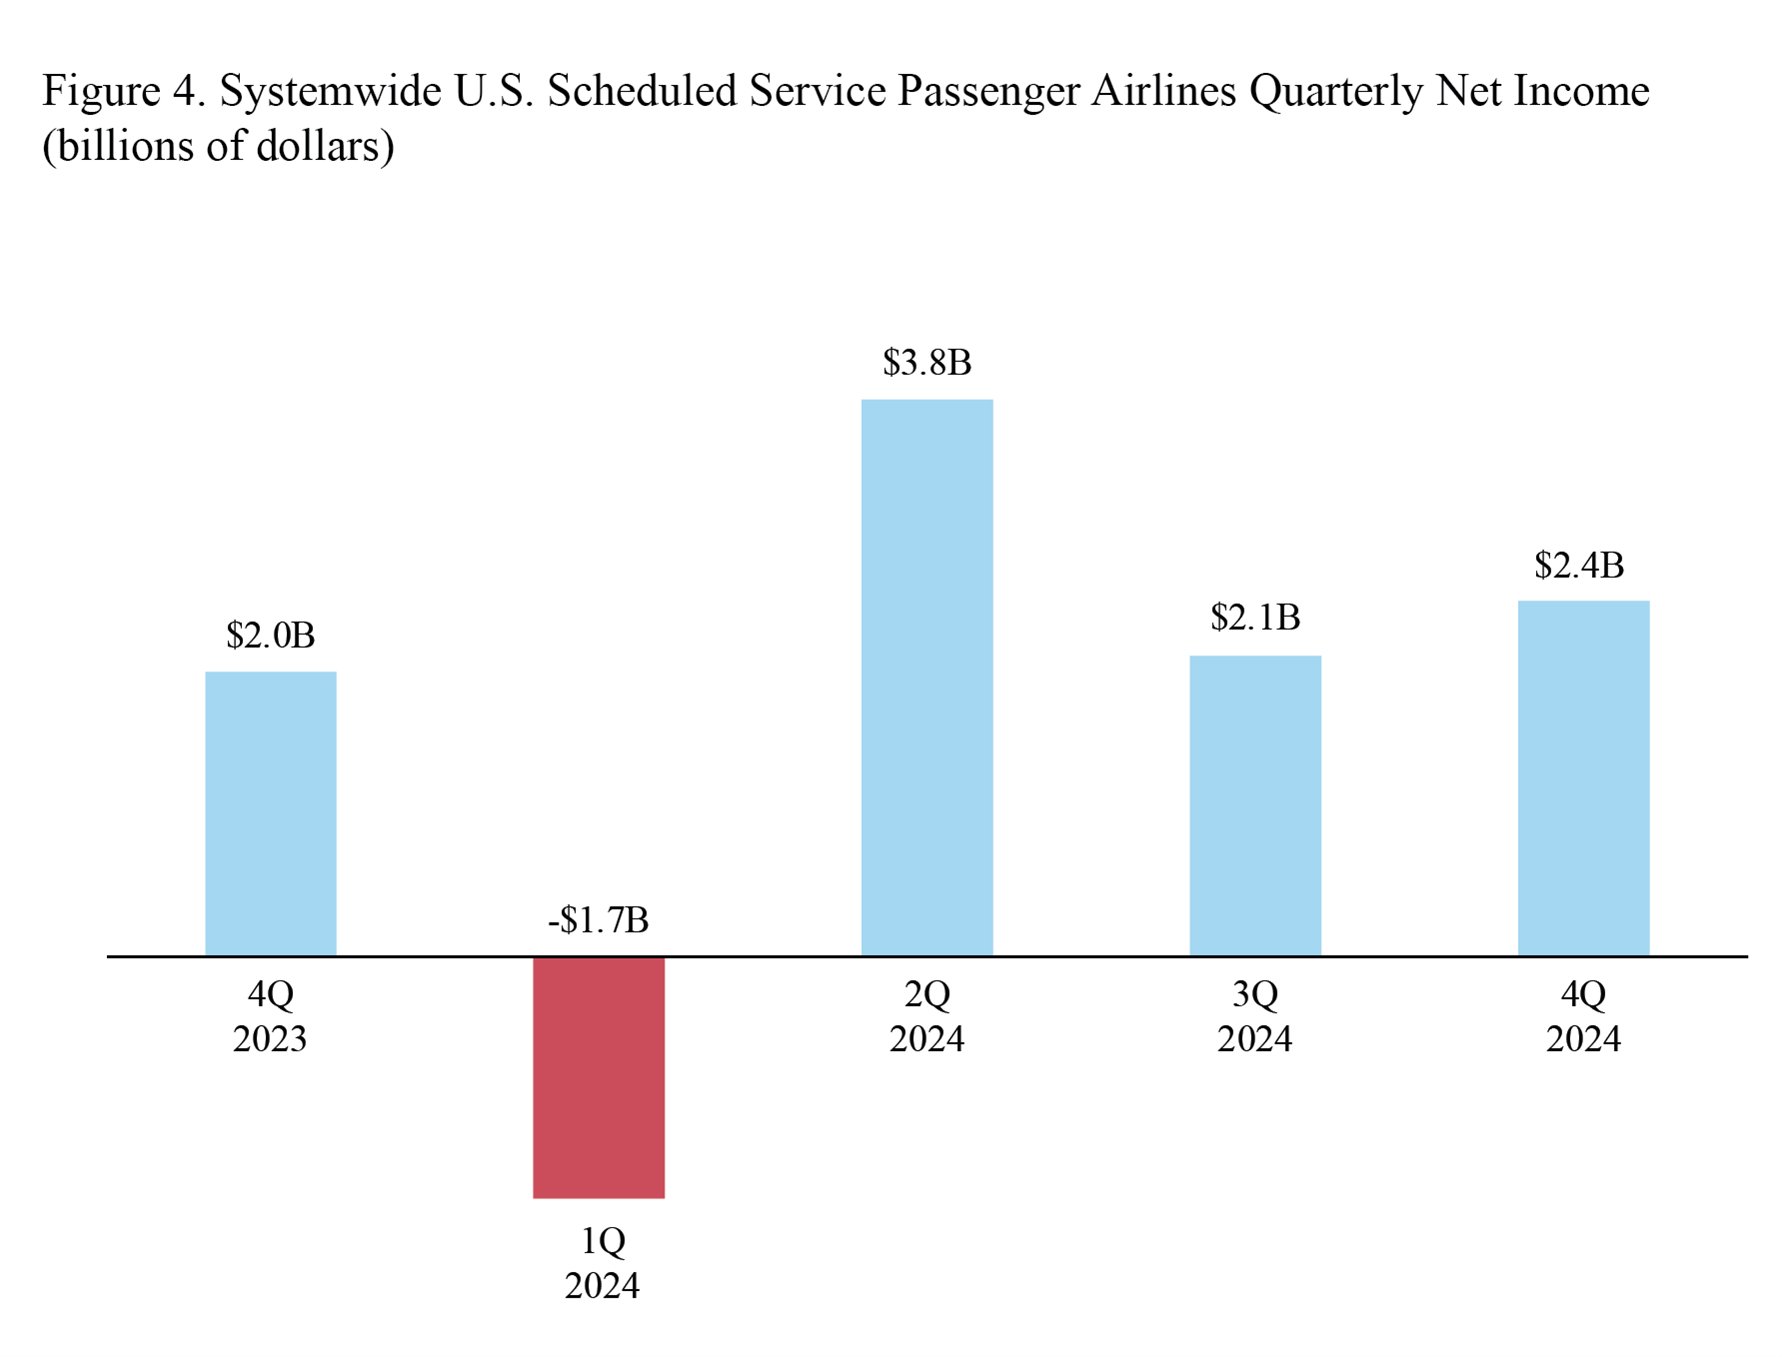
U.S. scheduled passenger airlines reported a fourth-quarter 2024 after-tax net profit of $2.4 billion and a pre-tax operating profit of $4.4 billion.
One year earlier, in the fourth quarter of 2023, the airlines reported an after-tax net profit of $2.0 billion and a pre-tax operating profit of $2.2 billion.
After-tax net income
- $2.4 billion profit in 4Q 2024
- Compared to $2.1 billion profit in 3Q 2024
- Compared to $2.0 billion profit in 4Q 2023
Pre-tax operating profit
- $4.4 billion profit in 4Q 2024
- Compared to $3.1 billion profit in 3Q 2024
- Compared to $2.2 billion profit in 4Q 2023
- Total 4Q 2024 operating revenue: $62.7 billion
- Share of total 4Q 2024 operating revenue:
- Fares: $46.5 billion, 74.2%, compared to 75.7% in 4Q 2023
- Baggage fees: $1.7 billion, 2.8%, compared to 2.9% in 4Q 2023
- Reservation change fees: $241 million, 0.4%, compared to 0.4% in 4Q 2023
- Share of total 4Q 2024 operating revenue:
Fees are included for calculations of net income, operating revenue and operating profit or loss.
- Total 4Q 2024 operating expenses: $58.2 billion
- Share of total 4Q 2024 operating expenses:
- Fuel: $9.7 billion, 16.7%, compared to 22.1% in 4Q 2023
- Labor: $22.0 billion, 37.7%, compared to 35.3% in 4Q 2023
- Share of total 4Q 2024 operating expenses:
Domestic operations, includes 24 U.S. airlines:
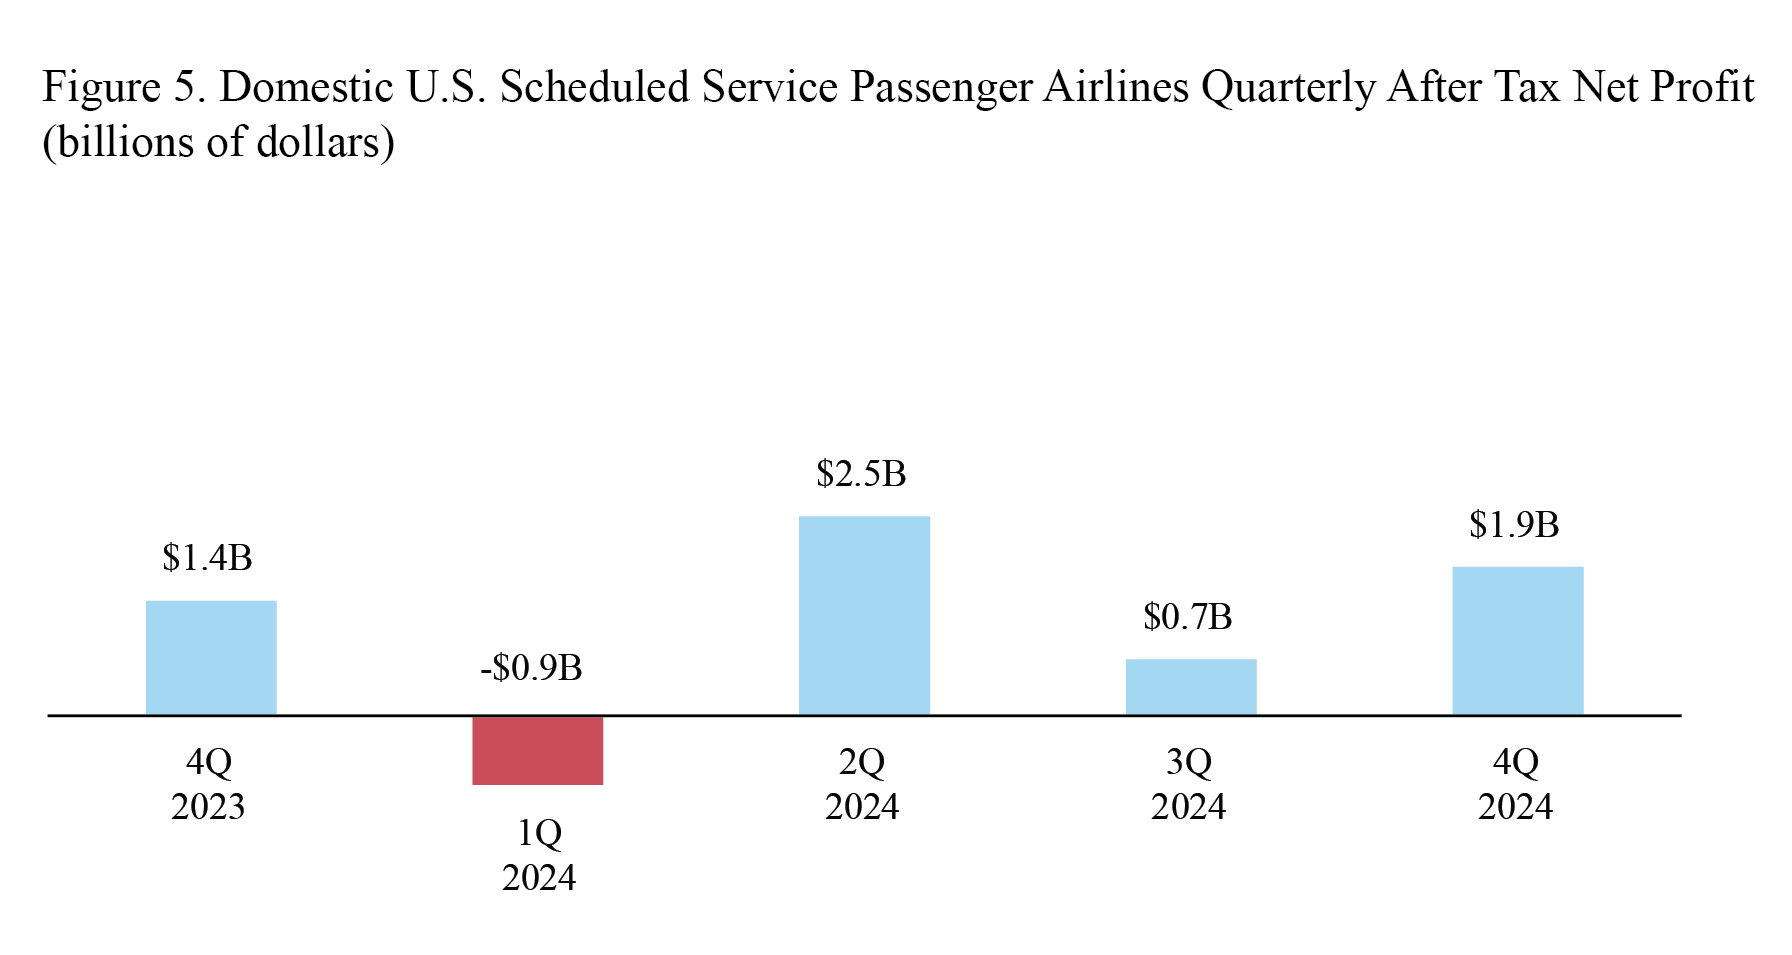
After-tax domestic net profit (net income)
- $1.9 billion profit in 4Q 2024
- Compared to $711 million profit in 3Q 2024
- Compared to $1.4 billion profit in 4Q 2023
Pre-tax domestic operating profit
- $3.4 billion profit in 4Q 2024
- Compared to $1.3 billion profit in 3Q 2024
- Compared to $1.9 billion profit in 4Q 2023
- 4Q 2024 domestic operating revenue: $47.5 billion
- Share of total 4Q 2024 domestic operating revenue:
- Fares: $34.0 billion, 71.6%, compared to 73.2% in 4Q 2023
- Baggage fees: $1.4 billion, 2.9%, compared to 3.1% in 4Q 2023
- Reservation change fees: $200 million, 0.4%, compared to 0.5% in 4Q 2023
- Share of total 4Q 2024 domestic operating revenue:
Fees are included for calculations of net income, operating revenue and operating profit or loss.
- 4Q 2024 domestic operating expenses: $44.1 billion, of which:
- Share of total 4Q 2024 domestic operating expenses:
- Fuel: $6.7 billion, 15.2%, compared to 20.2% in 4Q 2023
- Labor: $16.6 billion, 37.5%, compared to 35.4% in 4Q 2023
- Share of total 4Q 2024 domestic operating expenses:
International operations, includes 19 U.S. airlines:
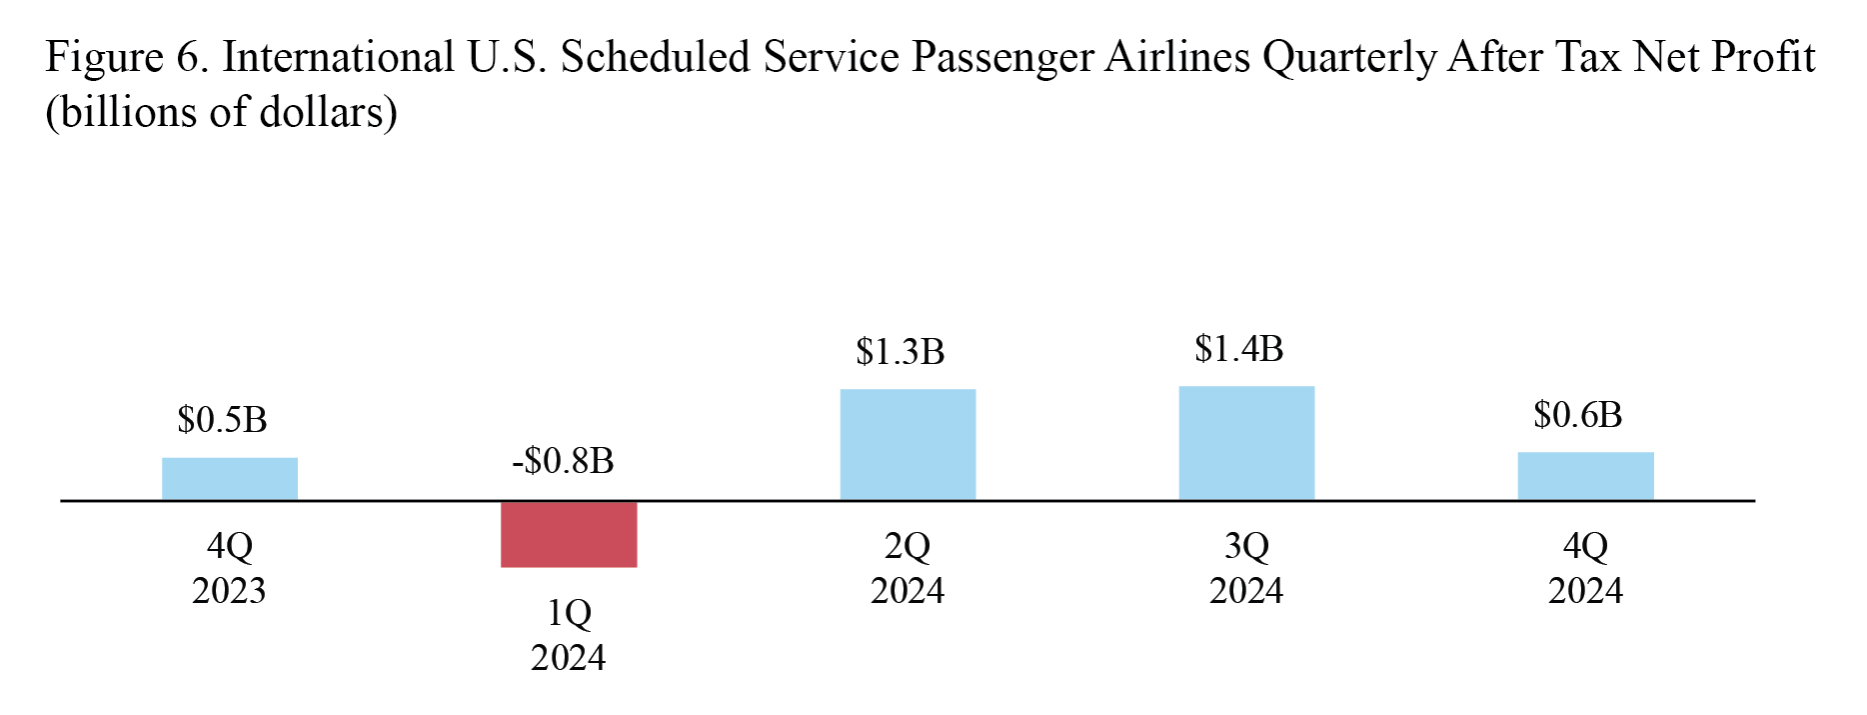
After-tax international net profit (net income)
- $572 million profit in 4Q 2024
- Compared to $1.4 billion profit in 3Q 2024
- Compared to $507 million profit in 4Q 2023
Pre-tax international operating profit
- $1.0 billion profit in 4Q 2024
- Compared to $1.8 billion profit in 3Q 2024
- Compared to $299 million profit in 4Q 2023
- 4Q 2024 international operating revenue: $15.1 billion, of which:
- Share of 4Q 2024 international operating revenue:
- Fares: $12.5 billion, 82.5%, compared to 83.6% in 4Q 2023
- Baggage fees: $337 million, 2.2%, compared to 2.3% in 4Q 2023
- Reservation change fees: $41 million, 0.3%, compared to 0.3% in 4Q 2023
- Share of 4Q 2024 international operating revenue:
Fees are included for calculations of net income, operating revenue and operating profit or loss.
- 4Q 2024 international operating expenses: $14.1 billion, of which:
- Share of total 4Q 2024 international operating expenses:
- Fuel: $3.0 billion, 21.5%, compared to 27.7% in 4Q 2023
- Labor: $5.4 billion, 38.3%, compared to 34.8% in 4Q 2023
- Share of total 4Q 2024 international operating expenses:
4th Quarter Margins
Net margin is the net income or loss as a percentage of operating revenue. Operating margin is the operating profit or loss as a percentage of operating revenue.
Systemwide:
Net income margin:
- 3.4% in 4Q2024
- Compared to 3.3% in 4Q2023
Operating margin:
- 7.1% in 4Q2024
- Compared to 3.7% in 4Q2023
Domestic
Net income margin:
- 3.9% in 4Q2024
- Compared to 3.2% in 4Q2023
Operating margin:
- 7.2% in 4Q2024
Compared to 4.2% in 4Q2023
International
Net income margin:
- 3.8% in 4Q2024
- Compared to 3.6% in 4Q2023
Operating margin:
- 6.9% in 4Q2024
- Compared to 2.1% in 4Q2023
Reporting notes
Additional data: BTS website, see tables for operating profit/loss, operating revenue and fuel cost and consumption. See the BTS financial databases for more detailed data including numbers for individual airlines.
Filing requirement: By regulation, for the quarter ending Dec. 31, airlines that operate at least one aircraft that is designed/certified for more than 60 seats or the capacity to carry a payload of passengers and cargo weighing more than 18,000 pounds must report financial data to BTS by March 31. The airline filings are subject to a process of quality assurance and data validations before release to the public.
Data updates: Revised carrier data and late data filings will be made available monthly on TranStats on the Monday following the second Tuesday of the month. All data are subject to revision. BTS will release first-quarter 2024 data on June 17, 2025.
Missing carriers: The information provided within BTS statistical releases may not be based on 100% of reporting carriers. Generally, data are released per schedule if reports have been received from at least 90% of the carriers, along with data from all the major carriers. Regarding this release, the following carriers remain pending: Air Wisconsin Airlines Corp (ZW), Aloha Air Cargo (KH), Northern Air Cargo Inc. (NC). Also, within text, percent change results may not be exact due to rounding.
To receive updates from BTS directly to your email, please consider subscribing to our GovDelivery service.