
2012 CFS Public-Use Microdata Visuals
The interactive dashboards below were created in Tableau and illustrate 2012 CFS data by State, CFS Area, Hazardous Material, and Temperature Controlled. The estimates displayed in the visuals are generated from the 2012 CFS Public-Use Microdata (PUM) file (Click Here). This file contains approximately 4.5 million shipments obtained from businesses included in the 2012 CFS. For the PUM file, disclosure avoidance techniques were applied to protect the confidentiality of the data of the CFS respondents. While properties in the original data were maintained to the extent possible, estimates generated by these dashboards are not exactly comparable to estimates provided in already published tables.
States
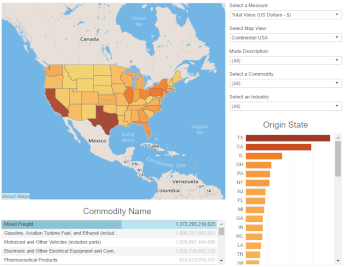
This dashboard provides interactive data by origin and destination State for total value, total tonnage, and total ton-miles. The visual can be filtered by transportation mode, commodity, and industry.
View this dashboard in Tableau
CFS Areas
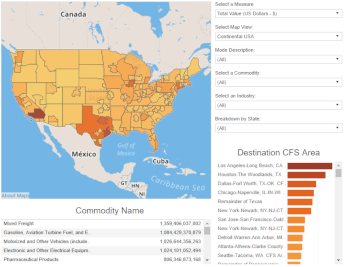
This dashboard provides interactive data by origin and destination CFS Area for total value, total tonnage, and total ton-miles. The visual can be filtered by transportation mode, commodity, and industry.
View this dashboard in Tableau
Temperature Controlled
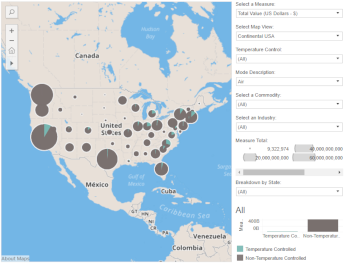
This dashboard provides interactive data by temperature controlled status for total value, total tonnage, and total ton-miles. The visual can be filtered by transportation mode, commodity, and industry.
View this dashboard in Tableau
Hazardous Materials
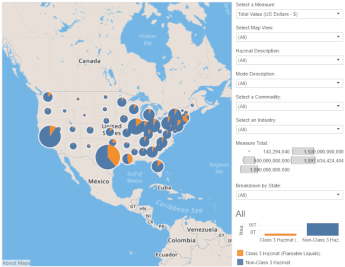
This dashboard provides interactive data by hazardous material status for total value, total tonnage, and total ton-miles. The visual can be filtered by transportation mode, commodity, and industry.
View this dashboard in Tableau