Newsroom
86
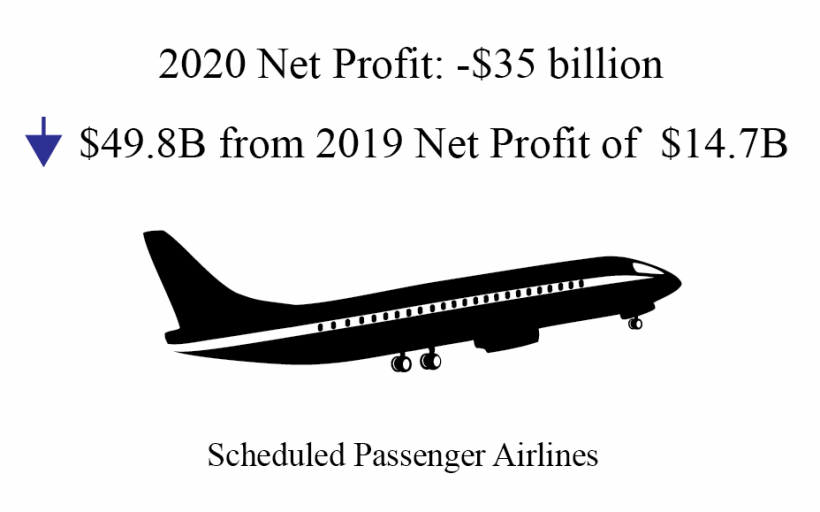
U.S. Airlines 2020 Net Profit Down $35 Billion from 2019
BTS 30-21
BTS Contact: Dave Smallen
david.smallen@dot.gov
National Transportation Atlas Database Spring 2021 Includes New Pipeline Dataset, 8 Other Updates
The Spring 2021 update to the National Transportation Atlas Database (NTAD) was released today with the new pipeline intermodal freight facility layer and eight updated datasets. The pipeline addition brings to 89 the total number of geospatial datasets in the NTAD collection representing the...North American Transborder Freight down 0.1% in February 2021 from February 2020
BTS 29-21
Wednesday, April 28, 2021
BTS Contact: Dave Smallen
Tel: 202-366-5568
david.smallen@dot.gov
![]()
Transborder freight between the U.S. and North American countries (Canada and Mexico) in February 2021:
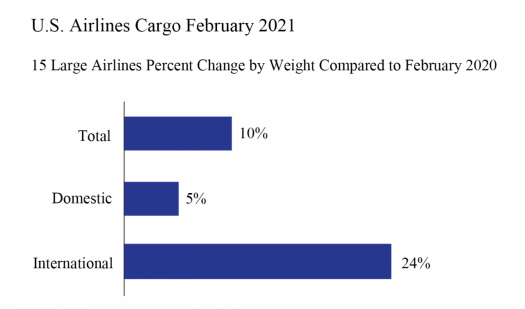
U.S. Airlines Carried 10% More Cargo in February 2021 than February 2020 (Preliminary)
Release Number: BTS 28-21